
 en.cryptonomist.ch
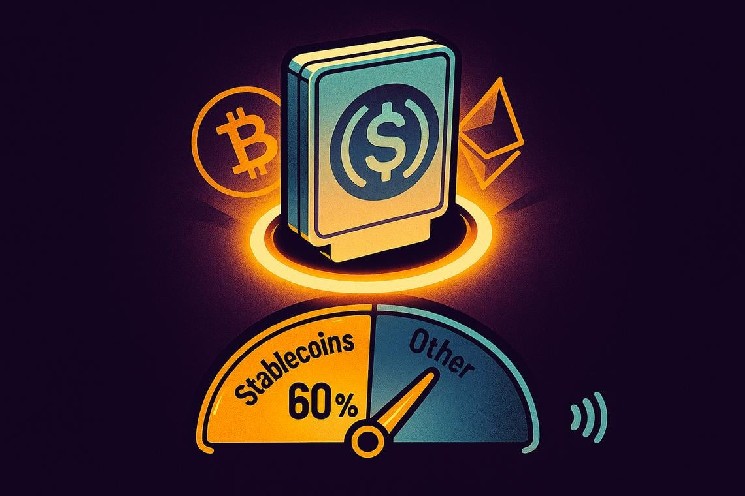
Something quiet happened in crypto buying habits during the first half of 2026, and the numbers are more striking than most people expected. Stablecoins didn’t just grow as an asset class — they took over the entire on-ramp. According to data published by Mercuryo, which analyzed six months of its own on-ramp transaction activity, crypto buying trends in H1 2026 were defined by a single, overwhelming shift: stablecoins climbed from 43% to 60% of all on-ramp volume, crossing the majority line in just one half-year period.
Key takeaways
- Stablecoins rose from 43% to 60% of on-ramp volume between H2 2025 and H1 2026, becoming the dominant asset purchased.
- 47% of new users made stablecoins their first crypto purchase, up sharply from 33% in the prior period.
- Ethereum’s volume share fell from 19.5% to 13.3%; Bitcoin’s dropped from 16.1% to 12.6%.
- Cards drove 66% of on-ramp volume from only 42% of purchases; mobile wallets handled 50% of transactions but saw their volume share shrink from 37% to 29%.
- 90% of purchases came from mobile devices, with Android users’ average order size growing 29% — outpacing iOS at 17%.
Stablecoins Cross the Majority Line
The backdrop helps explain the speed of the shift. The total crypto market cap fell roughly 30% in H1 2026, from $2.96 trillion to $2.08 trillion, according to Mercuryo’s report. Macro headwinds — trade tensions, delayed rate-cut expectations, capital rotating toward equities — pushed risk appetite down across the board. When markets compress, money tends to move toward less volatile assets. Stablecoins, primarily $USDT and $USDC, absorbed that demand almost entirely.
The growth showed up across three metrics simultaneously: volume share, transaction count share (rising from 33% to 41%), and average order size, which grew 28% half-over-half. All three moving in the same direction rules out noise. This was structural demand, not a one-off spike.
The new-user data makes the case even stronger. In H1 2026, 47% of new users made a stablecoin their very first purchase, up from 33% in the prior half — a 14 percentage point jump. New users adopted stablecoins even faster than repeat ones, who shifted by roughly 8.5 percentage points. Nearly every second person starting their journey through Mercuryo in H1 began with a digital dollar, not Bitcoin, not Ethereum.
That matters beyond what it says about market sentiment. It signals that stablecoins are no longer a secondary tool for traders who want to stay liquid between positions. They are increasingly the primary entry point — used for cross-border transfers, fast settlements, and holding value outside volatile assets. For builders in payments and Web3, the first-touch product experience is now a stablecoin experience first.
Bitcoin and Ethereum: Two Different Stories
As stablecoins absorbed more of the on-ramp, every other asset gave up relative ground. But Bitcoin and Ethereum gave it up in meaningfully different ways, and the distinction matters for anyone planning around demand.
Bitcoin’s Structural Floor vs. Ethereum’s Drift
Bitcoin’s volume share dropped from 16.1% to 12.6% — a 3.5 percentage point decline. But its share of purchases barely moved, slipping only from 12.5% to 12.2%. The dollar-volume decline largely reflects falling asset prices rather than falling demand. Bitcoin, according to Mercuryo’s data, behaved like the market’s fixed point — demand held steady even as the broader environment deteriorated.
Ethereum told a different story. Its volume share fell harder, from 19.5% to 13.3%, and its purchase share also declined, from 18.3% to 14.7%. Fewer people were buying $ETH, not just buying it at lower prices. $ETH demand tracked market direction more closely, amplifying in both directions with broader sentiment.
Among new users specifically, Bitcoin was the only major asset to gain first-purchase share — rising from 14.2% to 15.3%. Ethereum’s first-buy share slid from 18.4% to 15.0%, flipping the order of the two assets among newcomers. Among repeat users, $ETH still leads. The flip is an entry-point phenomenon, and it reinforces Bitcoin’s brand gravity: it remains the asset new users arrive for.
Solana: Frequency Without Size
Solana emerged as the half’s clearest outlier. $SOL climbed from 8.1% to 11.0% of all purchases, the fastest growth in purchase frequency of any major asset, making it the fourth most-bought asset on the platform. Yet its volume share moved far more slowly, from 4.4% to just 4.8%. The average $SOL order sat at roughly a third of the platform-wide average.
That pattern reflects a very specific user profile: frequent, small purchases from an active community that values speed and low fees over ticket size. $SOL’s volume share understates its weight in the actual checkout flow — at one in every nine purchases platform-wide, it generates a disproportionate number of transaction moments even if the dollar amounts are modest.
Payment Methods: Same Purchases, Very Different Money
The most counterintuitive finding in Mercuryo’s data may be the split between how often different payment methods are used versus how much money flows through them.
Cards Drive Large Volume Despite Fewer Purchases
Cards — Visa and Mastercard — accounted for 66% of on-ramp volume but only 42% of purchases, up from 55% of volume in H2 2025. The average card order grew 25% half-over-half, which explains the volume surge despite a slight dip in transaction count share (down roughly 2 percentage points to 42.4%). Cards are cementing their role as the tool for larger, more deliberate purchases — the kind where a user has decided to move serious money into crypto and reaches for the most familiar high-limit instrument they have.
Mobile Wallets Handle Half of Transactions but Shrinking Volume
Mobile wallets — Apple Pay and Google Pay — went the other way. They still accounted for 50% of all purchases, holding their position from H2 2025, but their volume share dropped sharply, from 37% to 29%. The reason: average mobile wallet order sizes shrank about 10% half-over-half. Users increasingly reach for mobile wallets for smaller, more routine purchases rather than large ones.
The two rails are no longer competing for the same job. Cards are where the money is; mobile wallets are where the habit lives. Product flows built around a single checkout experience miss that distinction entirely.
Mobile Devices and the Android Surprise
Nine in ten crypto purchases on Mercuryo came from mobile devices in H1 2026, consistent with H2 2025. The headline number is settled. The movement is in the details underneath it.
Android Users’ Average Order Size Outpaces iOS
The assumption that iOS users spend more per order — well-supported in broader e-commerce and subscription app data, including research from RevenueCat — did not hold in Mercuryo’s H1 data. Android users’ average order size grew 29% half-over-half, compared with 17% for iOS. Six months earlier, the two were nearly equal. By H1 2026, Android had moved into a roughly 10% lead in average order size.
The overall platform split changed little: iOS still accounted for 54% of transactions and 51% of volume, while Android represented just under 40% of both. But in terms of momentum, Android is where order sizes are growing fastest. Product teams that allocate development resources based on the premium-iOS-spender model risk under-investing in exactly the segment moving fastest right now.
Mobile Is Closing the Gap With Desktop
A second familiar assumption is also eroding: that desktop purchases are significantly larger than mobile ones. Mercuryo’s data shows that gap narrowing. Mobile order sizes are closing in on desktop, which means checkout flows built around the idea that big purchases come from desktops are aging out. Teams investing in high-value mobile UX — not just frictionless low-ticket flows — are building for where the data is pointing.
Overall Purchase Size Growth
Across all assets combined, the average purchase size on Mercuryo grew 16% between H2 2025 and H1 2026. The growth was not evenly distributed. Stablecoin orders drove the gain with a 28% increase in average size. Bitcoin’s average order shrank roughly 6%. Ethereum’s barely moved. Everything else fell around 10%.
The concentration of size growth in stablecoins reinforces the broader picture: the users moving larger amounts into crypto during H1 2026 were not doing it to buy Bitcoin or Ethereum at a discount. They were moving into stablecoins — deliberately, and in larger increments than before. Whether that reflects treasury strategies, cross-border payment use cases, or simple capital preservation, the purchasing behavior points the same direction regardless of the underlying reason.
What This Means for Builders
The H1 2026 data draws a fairly clear map for anyone building around payments or Web3. Stablecoin rails are no longer a secondary feature — they are the primary infrastructure. The depth and competitiveness of stablecoin settlement, fees, and speed increasingly determines whether a product captures on-ramp demand or loses it.
Payment design needs to reflect two distinct use cases rather than one. Card checkout can tolerate a bit more friction if it delivers higher limits or better fraud protection; mobile wallet flows must remain fast and low-friction for the frequent, smaller purchases that keep users engaged. Treating both as variations of the same checkout experience means under-optimizing for both.
The asset mix question is equally nuanced. Bitcoin and Ethereum no longer move on the same logic. Bitcoin demand appears structural and relatively insensitive to short-term market direction; Ethereum demand is more sentiment-driven. Solana adds a third distinct profile — high frequency, low ticket size, community-driven. Planning product infrastructure around a single “BTC/$ETH” category misses the real behavioral differences between them.
The more open question heading into H2 2026 is whether these trends accelerate or plateau. Will stablecoins cross half of all first purchases? Will Android’s order-size lead over iOS widen further? Will Solana’s purchase frequency growth translate into larger order sizes as its user base matures? The first Mercuryo on-ramping report sets a baseline — and the answers in six months will say as much about the direction of the broader crypto market as any price chart.
FAQ
What was the dominant crypto asset purchased on Mercuryo in H1 2026?
Stablecoins became the dominant asset, rising from 43% to 60% of on-ramp volume between H2 2025 and H1 2026. $USDT and $USDC combined drove that share, with average stablecoin order sizes also growing 28% over the same period.
How did Bitcoin and Ethereum’s volume shares change in H1 2026?
Bitcoin’s volume share dropped from 16.1% to 12.6%, while Ethereum’s fell more sharply, from 19.5% to 13.3%. Ethereum also lost ground in purchase count share, suggesting genuine demand decline rather than just price effects. Bitcoin’s purchase share held nearly flat, pointing to more structural demand.
What payment methods do users prefer for different purchase sizes?
Cards — Visa and Mastercard — are preferred for larger purchases, accounting for 66% of volume from just 42% of transactions, with average card order sizes growing 25%. Mobile wallets — Apple Pay and Google Pay — are favored for smaller, more frequent transactions, handling 50% of purchases but only 29% of volume, with average order sizes declining around 10%.
How did device usage influence crypto purchases in H1 2026?
90% of crypto purchases on Mercuryo came from mobile devices. Android users’ average order size grew 29% half-over-half, outpacing iOS growth of 17%, challenging the common assumption that iOS users spend more per purchase. The gap between mobile and desktop average order sizes also narrowed during the period.
Article produced with the assistance of artificial intelligence and reviewed by the editorial team.