
 thecryptobasic.com
$XRP remains under pressure as its downtrend continues, but new derivatives data suggests that leveraged trading activity is picking up again.
While bulls continue to wait for a relief rally, the latest figures show that traders are becoming more active in the futures market, and this change could influence $XRP’s next move.
In a recent disclosure, CryptoQuant analyst Arab Chain reported that the 30-day Open Interest (OI) Z-Score for $XRP futures on Binance has risen to about 1.60.
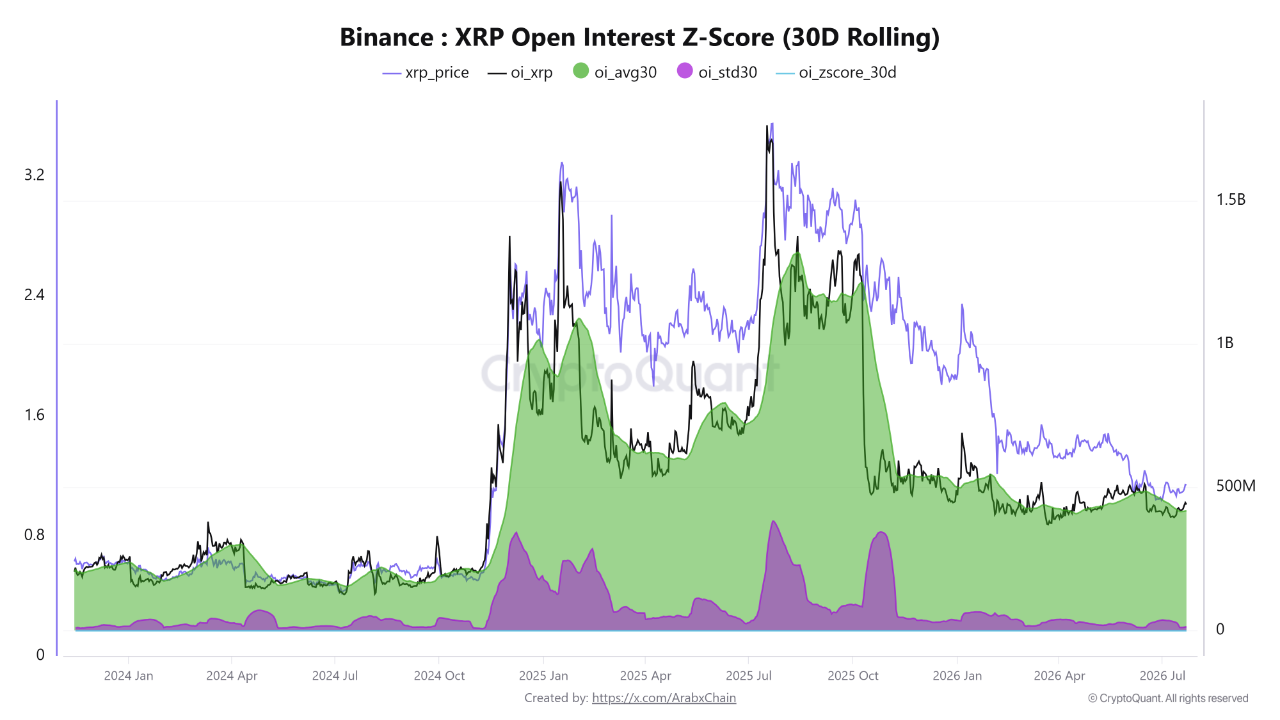
The analyst also confirmed that total open interest has climbed to roughly 440.6 million $XRP, compared with a 30-day moving average of 418.5 million $XRP.
In addition, $XRP’s standard deviation has reached about 13.8 million tokens, and this indicates that participation in the derivatives market has increased over the past month.
More Traders Return as Open Interest Moves Higher
According to Arab Chain, the higher Z-Score means that open interest now sits above its 30-day historical average. This suggests that the $XRP futures market is witnessing a quicker return of leveraged trading and stronger participation.
However, the analyst stressed that current activity remains far below what the market recorded during $XRP’s 2025 peak.
At that time, open interest climbed above 1 billion $XRP, and $XRP also enjoyed a strong price rally. Although trader participation has improved, it still has a long way to go before reaching those earlier levels.
Arab Chain believes that if the price and open interest continue to rise together, it could show growing confidence among traders and support a stronger bullish trend.
On the other hand, the analyst warned that rising open interest without a matching increase in price could indicate that traders are taking on more leveraged speculative positions.
If this happens, the market could become more vulnerable to large liquidation events, leading to sharper price swings in either direction.
$XRP Remains Stuck in a Tight Trading Range
Meanwhile, data from the $XRP daily chart shows that the token is still waiting for a clear breakout. At the time of the report, $XRP traded near $1.13, with buyers and sellers remaining evenly matched.
$XRP trades above the 20-day Exponential Moving Average (EMA20) at $1.11 but remains below the 50-day Exponential Moving Average (EMA50) at $1.1448. The longer-term 200-day Exponential Moving Average (EMA200) stands at $1.43, showing that the trend still faces strong resistance.
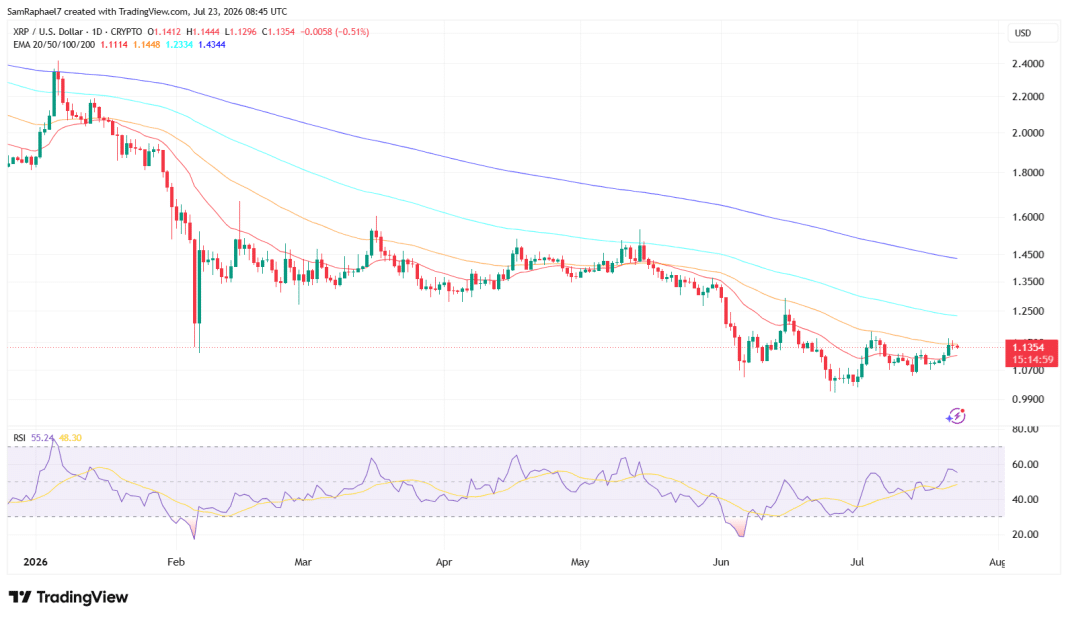
Further, the Relative Strength Index (RSI) stands at 55.24, staying above the midpoint but without showing strong momentum. At the same time, the MACD remains almost flat, with the MACD line at 0, the signal line at -0.01, and the histogram at just +0.01.
Notably, $XRP now faces two possible paths. A daily close above $1.15 alongside stronger trading volume could open the door to $1.16 and later the $1.25-$1.30 range. However, if $XRP falls below $1.11, the next downside target could be $1.06, with $1.00 acting as the final major support.