
 coinedition.com
Hedera trades at $0.07314 on July 23, up 0.38%, bouncing sharply from its June lows after reclaiming the 20-day EMA in the previous session. A 4.07 billion $HBAR treasury release is sitting in Hedera’s own Q3 2026 forecast column, worth approximately $268M at current prices, arriving just as the network’s eight-year treasury-funded model approaches its final stage and fees become the only remaining funding source.
$HBAR Reclaimed The 20-Day EMA But The Bollinger Bands Tell The Full Story
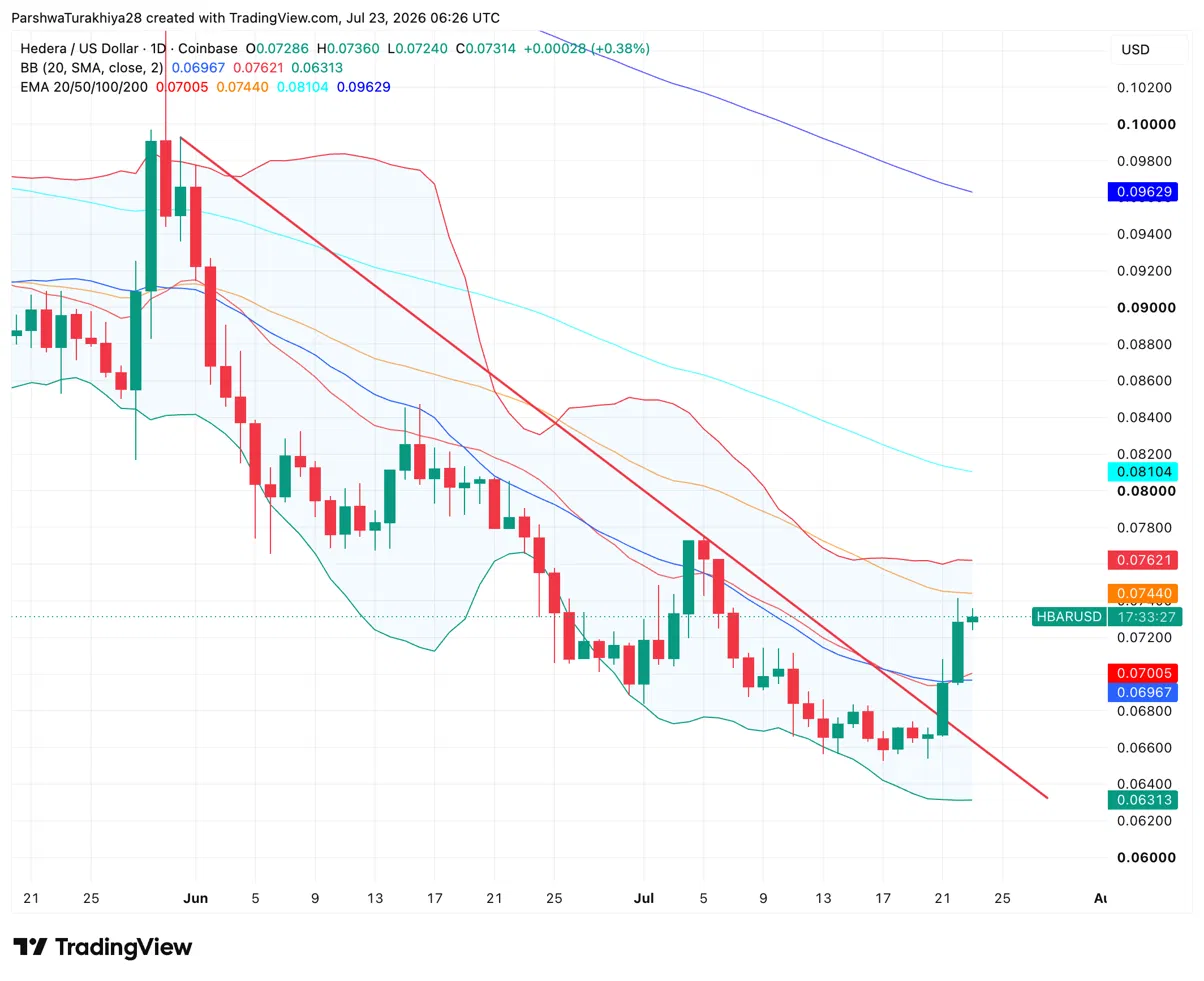
The daily chart shows $HBAR breaking above the 20-day EMA at $0.07005 and the Bollinger midline at $0.06967 in Tuesday’s session, the first time both levels have been cleared since the June selloff began. The move pushed price to $0.07360 intraday before today’s slight pullback to $0.07314. A descending red trendline that has capped every recovery since the June peak near $0.10 sits just above the 50-day EMA at $0.07440, making that cluster the immediate test.
Related: Lorenzo Protocol Price Prediction: BANK Rally Extends After 335% Weekly Surge as Bulls Target $0.34
The Bollinger upper band at $0.07621 is the next ceiling above, followed by the 100-day EMA at $0.08104. The lower Bollinger Band at $0.06313 and the June lows near $0.06600 define the floor below. All four EMAs continue to slope downward, meaning the broader trend remains bearish even as the short-term momentum has shifted. A close above the 50-day EMA and the descending trendline on volume would be the first genuine signal that the recovery has legs beyond a relief bounce.
What Are The Key Support And Resistance Levels For $HBAR Today?
| Type | Price | Level |
| Support | $0.07005 | 20-Day EMA (reclaimed Tuesday) |
| Support | $0.06967 | Bollinger Midline (reclaimed Tuesday) |
| Support | $0.06600 | June lows (recent floor) |
| Support | $0.06313 | Lower Bollinger Band (absolute floor) |
| Resistance | $0.07440 | 50-Day EMA / Descending trendline cluster |
| Resistance | $0.07621 | Bollinger Upper Band |
| Resistance | $0.08104 | 100-Day EMA (next major target) |
The $268M Treasury Release: What The Forecast Column Actually Says
Hedera’s Q3 2026 treasury management report shows 4.07 billion $HBAR scheduled for release, with 3.88 billion coming from the ecosystem development program. At current prices: approximately $268M. This would be the second largest quarterly distribution in network history. However, the same line rolled forward without executing in at least three prior consecutive quarters. Actual tokens moved in Q2 2026 were 186 million — not the billions forecast.
Analyst FireHustle reviewed every quarter in the treasury table and found a consistent pattern. The ecosystem development forecast line was 3.72 billion the quarter before Q3 and rolled forward without moving. The quarter before that, the same thing happened. FireHustle offered two readings:
| Interpretation | What It Means for $HBAR |
| Foundation is deliberately slowing distributions | Positive for supply — tokens not hitting the market as forecast |
| Forecast column is unreliable | Transparency concern for a network marketing itself to institutional buyers |
If the Q3 release executes as forecast, treasury distribution hits 47.5 billion of the 50 billion total, leaving less than 5% unreleased. If it rolls again, the Hedera Foundation will have deferred this specific line four consecutive quarters.
The Fee Problem That Changes the Long-Term Picture
Daily network fees: $1,354. Annual run rate: approximately $1.5M. Market cap: approximately $3B. The treasury is approaching 95% distributed. Once it is gone, the $1.5M annual fee run rate must carry what a 50 billion token treasury used to fund — grants, developer incentives, staking rewards, and node rewards. FireHustle confirmed the $1,354 figure three separate times before including it.
| Metric | Value |
| Daily Network Fees (Jul 23) | $1,354 |
| Estimated Annual Fee Revenue | ~$1.5M |
| $HBAR Market Cap | ~$3B |
| Treasury Distribution Progress | ~47.5B of 50B $HBAR (approaching 95%) |
| Fee Adjustment (Jan 2026) | Common transaction type raised from 0.1 to 0.8 — first change since 2019 |
| Fee Destination | Staking rewards, node rewards, network treasury (daily distribution) |
| Burns | None — fees are not destroyed |
Hedera fees do not burn $HBAR. Per the network’s own developer documentation, fees collect in an account and are distributed once daily to the staking rewards account, the node rewards account, and the network treasury. Nothing is destroyed. The deflationary narrative popular in $HBAR communities does not reflect how the fee system actually operates.
Hedera raised fees on one of its most common transaction types from 0.1 to 0.8 in January 2026, the first fee adjustment since 2019, citing long-term economic sustainability. Whether that adjustment is enough to bridge the gap when treasury funding ends is the question the market has not yet priced.
EVM Compatibility Opens The Developer Pipeline
Hedera achieved full Ethereum Virtual Machine compatibility, allowing developers to deploy Solidity smart contracts directly using existing Ethereum tools.
That removes the primary technical barrier that kept Ethereum-native developers from building on Hedera, and it arrives at a moment when the network needs on-chain activity to grow fees into a credible treasury replacement. EVM compatibility alone does not generate revenue, but it expands the addressable developer base at the exact time fee growth matters most.
What Derivatives Show About Current Positioning
| Metric | Value | Signal |
| 24h Volume | $135.74M (+18.53%) | Rising volume confirms active trading on the bounce |
| Open Interest | $95.75M (-1.61%) | Falling OI confirms position closures — shorts exiting |
| Short Liquidations (24h) | $330.13K | 10:1 ratio vs longs — short squeeze confirmed |
| Long Liquidations (24h) | $31.39K | Long side largely untouched during the rally |
| Top Trader L/S (Accounts) | 1.81 | Large accounts net long |
| Top Trader L/S (Positions) | 1.48 | Position sizing also net long |
| Retail L/S Ratio | 0.9011 | Near balanced — smaller traders not yet chasing the move |
Volume rising 18.53% while open interest fell 1.61% is the specific signature of a short squeeze: existing shorts are closing positions (adding volume) rather than new longs entering (which would push OI higher). The 10:1 short-to-long liquidation ratio confirms this. The rally is running over trapped shorts rather than being driven by fresh conviction buying. Whether new longs enter after the squeeze exhausts determines whether the move sustains or fades.
Hedera Price Prediction: Upside and Downside Targets
- Upside case: $HBAR holds the 20-day EMA at $0.07005, clears the 50-day at $0.07440 and the descending trendline on volume, EVM compatibility drives fresh developer activity, and the treasury release rolls forward again rather than creating sell pressure, opening a path toward the 100-day EMA at $0.08104.
- Downside case: The treasury release proceeds as forecast and the Hedera Foundation moves tokens toward exchanges, $HBAR loses the 20-day EMA support at $0.07005, and price retests the lower Bollinger Band at $0.06313 as the fee sustainability concern weighs on longer-term holders.