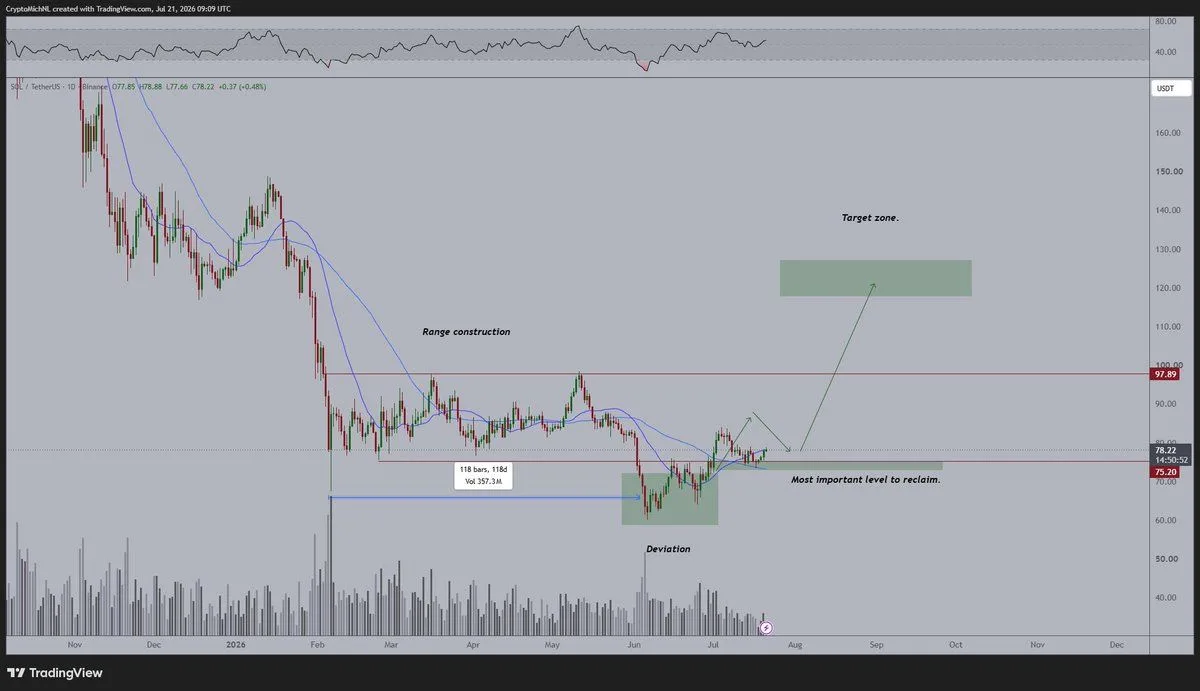
$SOL daily chart. Source: Michaël van de Poppe/X
The main level to hold is around $75, which previously acted as range support. Staying above it could allow $SOL to challenge nearby resistance before testing the range high near $98.
A confirmed breakout above $98 would strengthen the path toward the $118–$127 target zone. However, another loss of $75 could delay the rally and expose support around $68, followed by the previous deviation zone near $60–$65.
Solana Could Target $150 by October
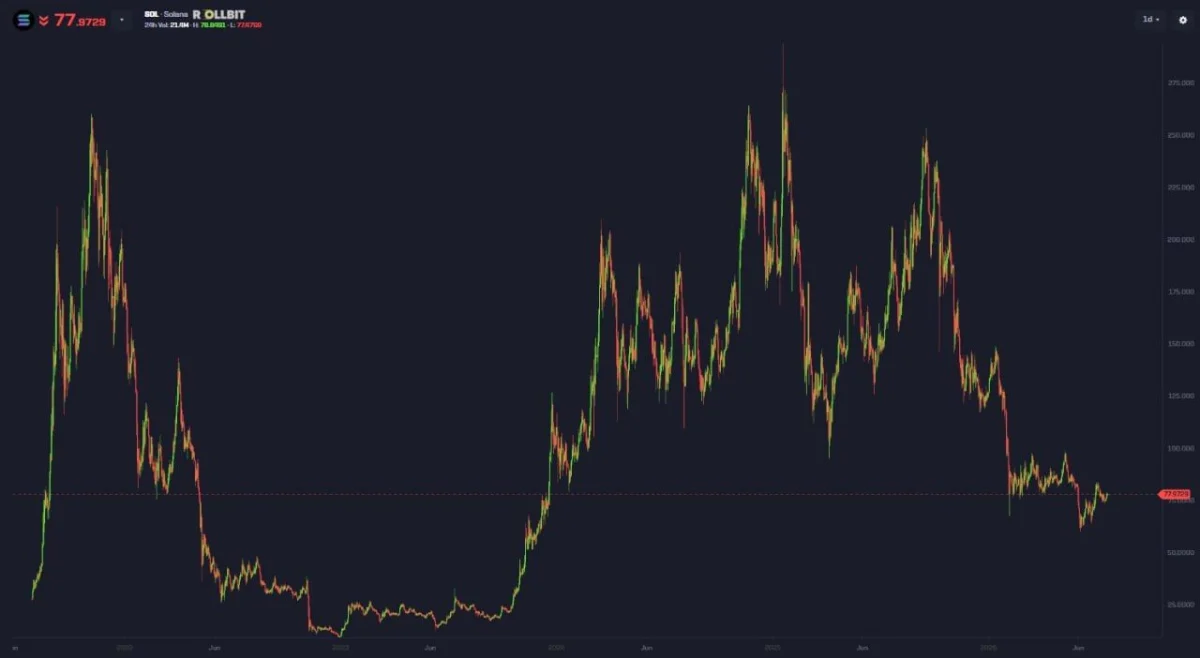
Solana could extend its recovery toward $150 by October, according to analyst Shah. The projection depends on $SOL building momentum from its current support region and reversing the broader sequence of lower highs.
$SOL daily chart. Source: Shah/X
The first major test sits around $90–$100. Reclaiming this zone would improve the structure and open the way toward $120–$125, which could act as the final major resistance before $150.
However, the chart does not yet confirm such a large rally. $SOL must continue holding the $70–$75 region, while a breakdown below it could expose the recent low near $60 and invalidate the October target.

 coinpaper.com