
 crypto.news

Ripple’s native token pushed back toward $1.13 on Tuesday as buyers defended the $1.08-$1.10 area and tried to turn a short-term recovery into a breakout.
At press time, crypto.news market data showed $XRP near $1.13, up about 4.1% over 24 hours.
The rebound has improved short-term momentum, but the larger structure remains weaker. The token still trades inside a descending channel that has limited rallies, leaving the market with two different signals: a possible near-term breakout and a broader trend that has not yet turned bullish.
$XRP tests $1.13 as traders watch $1.35
Crypto analyst Ali Martinez said $XRP’s monthly chart had produced a TD Sequential buy signal, while the hourly chart showed price compressing inside a symmetrical triangle. He said a sustained move above $1.13 could open a roughly 20% rally toward $1.35. The setup gained attention as the token climbed from the lower end of its recent range.
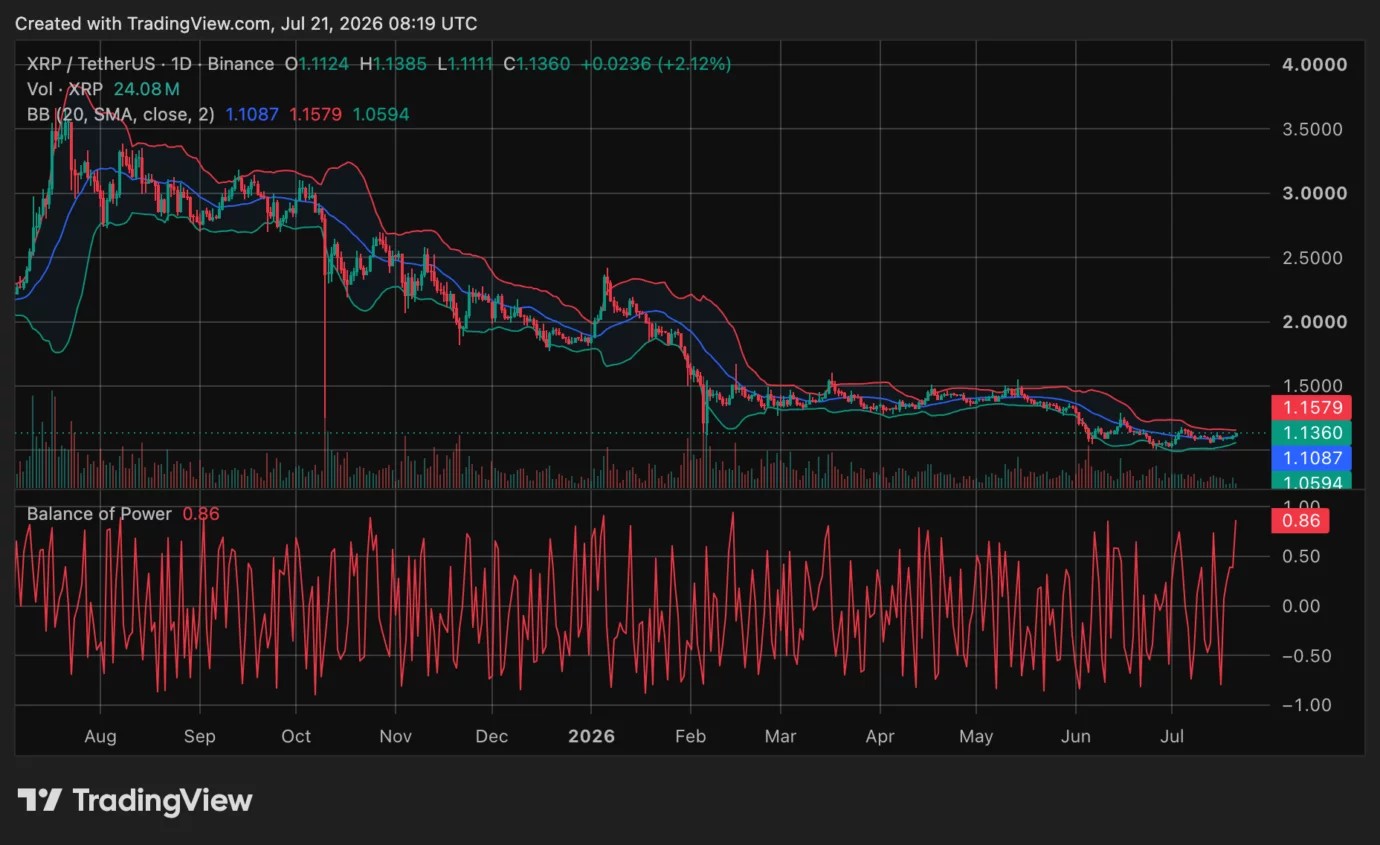
However, $1.13 is only the first test. A recent crypto.news analysis placed resistance near $1.17, followed by about $1.27 and $1.37 if buyers continue to gain control. The supplied daily chart also shows $XRP above the middle Bollinger Band near $1.11 but below the upper band around $1.16. A close above $1.16 would strengthen the recovery, while a drop below $1.11 would weaken momentum.
The Balance of Power indicator near 0.86 points to strong buying pressure on the latest candle. Still, one strong reading does not confirm a trend reversal. $XRP has produced several relief rallies during its wider decline, so buyers still need to hold reclaimed levels and build volume above resistance.
ETF inflows support the rebound
U.S.-listed spot $XRP ETFs recorded $2.49 million in net inflows on July 20, according to SoSoValue data. Bitwise’s fund was the only product to record net buying for the session, lifting its cumulative inflows to about $501 million. Total $XRP ETF assets stood near $1.017 billion, while cumulative net inflows remained around $1.489 billion.
JUST IN: $XRP spot ETFs recorded $2.49 million in net inflows yesterday (July 20).
— 𝗕𝗮𝗻𝗸XRP (@BankXRP) July 21, 2026
Bitwise's BWXRP was the sole contributor, pushing its cumulative inflows to $501 million.
Total $XRP ETF AUM now stands at $1.017 billion, with cumulative net inflows of $1.489 billion since… pic.twitter.com/s9qxtD1wYQ
That demand continues a pattern seen through much of 2026. $XRP ETFs have absorbed close to one billion tokens while exchange reserves have fallen to multi-year lows. Yet the tighter available supply has not produced a sustained rally. $XRP has remained far below its July 2025 peak despite steady ETF demand.
U.S. spot $XRP ETFs attracted $6.78 million last week while the listed products held about 971 million $XRP. That steady demand provides support, but price still needs a clear technical break before traders can treat the current move as more than another rebound inside a larger decline.
Analysts split over the larger trend
The latest bounce has produced sharply different long-term forecasts. EGRAG CRYPTO said $XRP may be forming a third macro bottom around the $0.90-$1.00 area, supported by long-term exponential moving averages. His roadmap places $1.23 as an initial reclaim level and $1.56 as a stronger confirmation before much higher long-term targets.
Those projections remain speculative. EGRAG said the third bottom has not yet been fully confirmed, while his targets of $9, $15 and $31 rely on Fibonacci extensions and a future macro breakout.
#$XRP – Triple-Bottom Roadmap to $9, $15 & $31:
— EGRAG CRYPTO (@egragcrypto) July 21, 2026
Sometimes, when I chart #$XRP, it feels like I can see the future not with certainty, but by anticipating the macro structure.
This chart presents a three-bottom sequence of rising cyclical lows, supported by $XRP’s long-term… pic.twitter.com/1O0mudYgvP
Chart analyst ChartNerd has taken a more cautious view, arguing that $XRP remains in a long-term downtrend after a bearish 20-week and 50-week EMA crossover formed earlier in 2026.
ChartNerd said rallies toward roughly $1.29 or even $1.60 could still face heavy resistance unless $XRP breaks above its larger descending structure. The broader technical picture also remains cautious, with recent analysis placing $XRP beneath descending resistance despite improving short-term price action.
A move toward $1.35 would confirm the short-term triangle breakout described by Martinez, but $XRP would still need to reclaim higher weekly resistance before the larger trend changes. The divide between improving momentum and continued long-term weakness remains central to the current setup.
$XRP bulls need to clear $1.16
The clearest short-term levels sit close to the current price. The $1.11 area, which aligns with the middle Bollinger Band, acts as the first support. The $1.16 area marks the upper band and a nearby resistance zone. A sustained move through that level would strengthen the case for a push toward $1.20, $1.27 and eventually $1.35.
On the downside, losing $1.11 would weaken the latest recovery and put the $1.08-$1.10 area back in focus. A deeper breakdown could return attention to the $1.05-$1.00 zone, where buyers have recently defended the market.
Meanwhile, institutional demand remains a supporting factor rather than a confirmed breakout driver.