
 thecryptobasic.com
$XRP remains under pressure, but new data from the derivatives market suggests selling pressure has eased.
CryptoQuant analyst Pelinay recently said several Binance indicators now show that $XRP has moved into a neutral market structure even as the broader downtrend continues.
According to Pelinay, the latest liquidation data and Binance funding rate reveal four important signals that support this theory.
$XRP Liquidation Data Shows a Balanced Market
Pelinay first mentioned Binance’s liquidation data. The figures show that long liquidations stand at about 103,000 $XRP, while short liquidations are around 122,000 $XRP. The small gap shows that neither side has suffered significantly larger losses.
The analyst explained that much higher long liquidations would have indicated strong selling pressure, as bullish traders would have been forced out of their positions.
On the other hand, much higher short liquidations would have pointed to a short squeeze due to stronger buying activity. Since both figures remain close, neither bulls nor bears currently hold a clear advantage.
Pelinay believes this shows that $XRP has moved away from the heavy selling pressure seen earlier and has entered a more neutral stage.
Funding Rate Confirms the Neutral View
The second pointer from the derivatives market is the funding rate, which remains close to zero. This confirms the neutral outlook because it shows traders have not heavily favored either long or short positions.
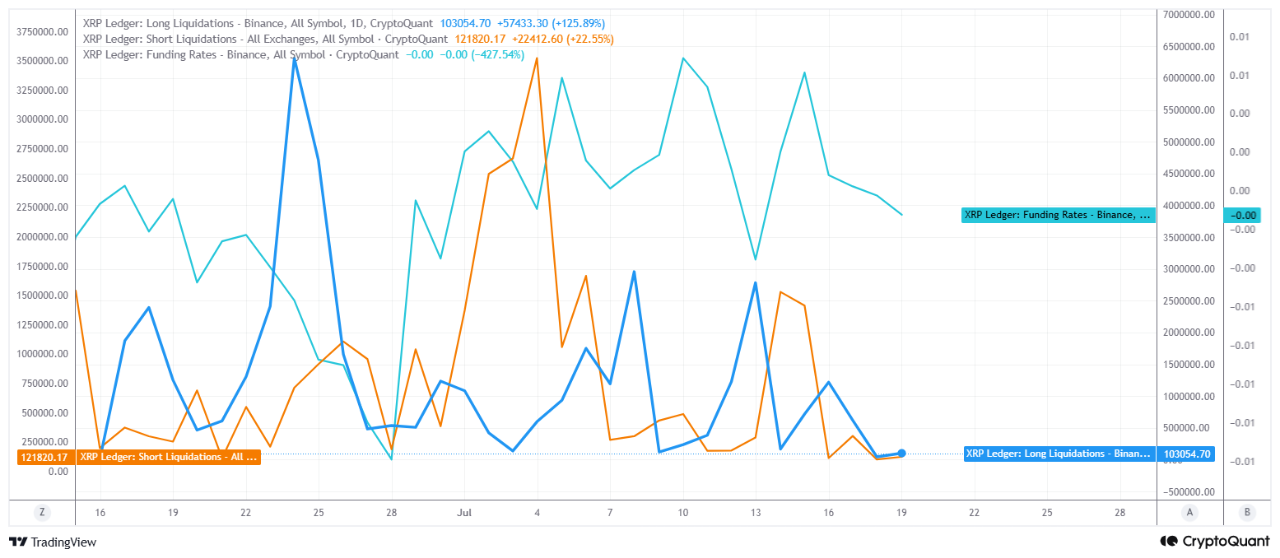
For the third sign, the analyst added that the similar liquidation figures also show that leveraged long and short positions remain fairly balanced.
Because of this, price swings continue to trigger liquidations on both sides instead of affecting only one group of traders. This shows limited confidence in either direction and frequent short-term reversals.
The fourth sign is that a major squeeze on either side is not likely. Notably, the funding rate near zero shows that traders are not showing excessive optimism or strong bearish sentiment. Combined with the liquidation data, it suggests investors have not yet settled on a clear direction for $XRP despite the ongoing weakness.
$XRP Continues to Hold a Key Support Zone
While derivatives data shows a neutral market, $XRP’s price continues to face pressure on the charts. As of July 20, $XRP trades at $1.08, which places it near the lower end of an important short-term support area.
Bulls now need to protect the $1.08 to $1.10 range to keep hopes of a recovery alive. The daily chart still shows a downtrend that has remained in place since July 2025.
Currently, $XRP trades more than 70% below its cycle high of $3.6, reached in the summer of 2025. On June 26, the token fell to about $1.008, marking a 19-month low and its strongest test of the important $1.00 level since November 2024.
Price Levels to Watch
The moving averages also show the bearish outlook across multiple timeframes. The 50-day simple moving average (SMA) sits at $1.12, the 100-day SMA stands at $1.25, and the 200-day SMA is at $1.42. All three levels now act as resistance that $XRP must overcome before a stronger recovery can begin.
On the downside, buyers have continued to defend the $1.00 to $1.06 support zone, helping absorb recent selling pressure.
However, a daily close below $1.00 could send $XRP toward $0.80. Before reaching that level, the $0.90 to $0.93 area also stands out as an important support zone. A break below that range would weaken the current recovery outlook.
If buyers manage to push the price higher, $XRP must first reclaim $1.13, which has now changed from support to resistance. Above that, the next major hurdle lies between $1.15 and $1.20, where the 50-day EMA meets an important Fibonacci resistance level.