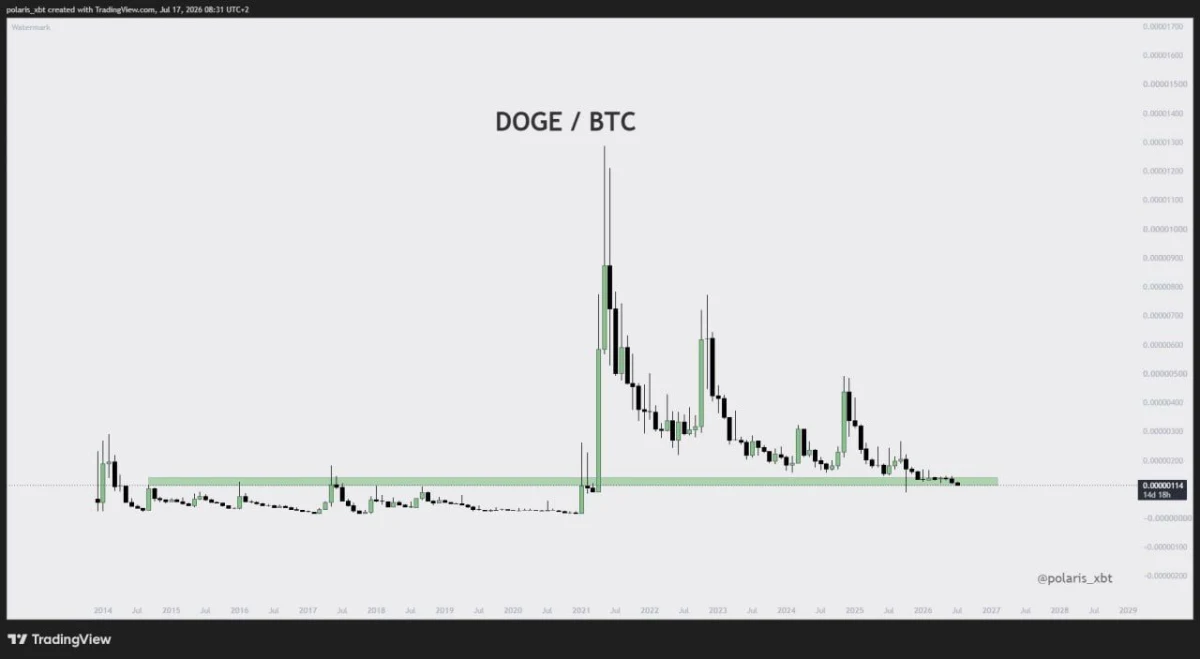
$DOGE/$BTC monthly chart. Source: Polaris/X
The chart places $DOGE/$BTC near 0.00000114 $BTC, inside a zone that previously acted as a base before major expansions. However, the pair has continued forming lower highs since its 2021 peak, showing that Bitcoin still holds the stronger long-term trend.
Holding the zone could allow $DOGE/$BTC to build a bottom and begin a broader consolidation. Buyers would still need to produce a higher monthly low and reclaim nearby resistance before the move can be treated as a real reversal.
A monthly close below support would weaken the historical comparison and suggest Dogecoin may continue underperforming Bitcoin. Until the level holds and momentum improves, the chart remains at a decision point rather than a confirmed $DOGE breakout.
Dogecoin Tests $0.07 as Downtrend Reaches a Decision Point
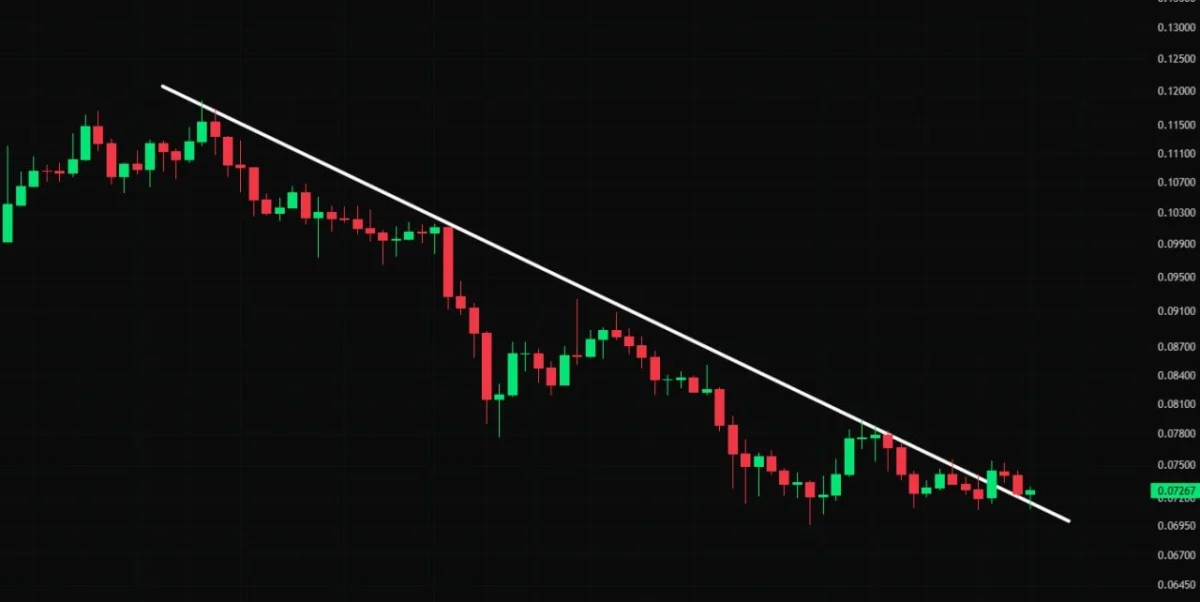
Dogecoin is testing a key support area near $0.07 while pressing against the descending trendline that has controlled price for months. A strong reaction here could mark the first step toward a short-term reversal.
$DOGE chart. Source: CryptoJack/X
The trendline has repeatedly rejected $DOGE during earlier recovery attempts, keeping the wider structure bearish. Buyers now need to break above it and hold the level during a retest to confirm that selling pressure is weakening.
A successful breakout could return attention to the $0.075-$0.078 region, followed by stronger resistance around $0.081. However, losing the current support zone would preserve the downtrend and expose lower levels near $0.067-$0.065.
For now, Dogecoin is at a decision point. Support is holding, but the reversal remains unconfirmed until $DOGE closes clearly above the trendline.

 coinpaper.com