cryptopotato.com
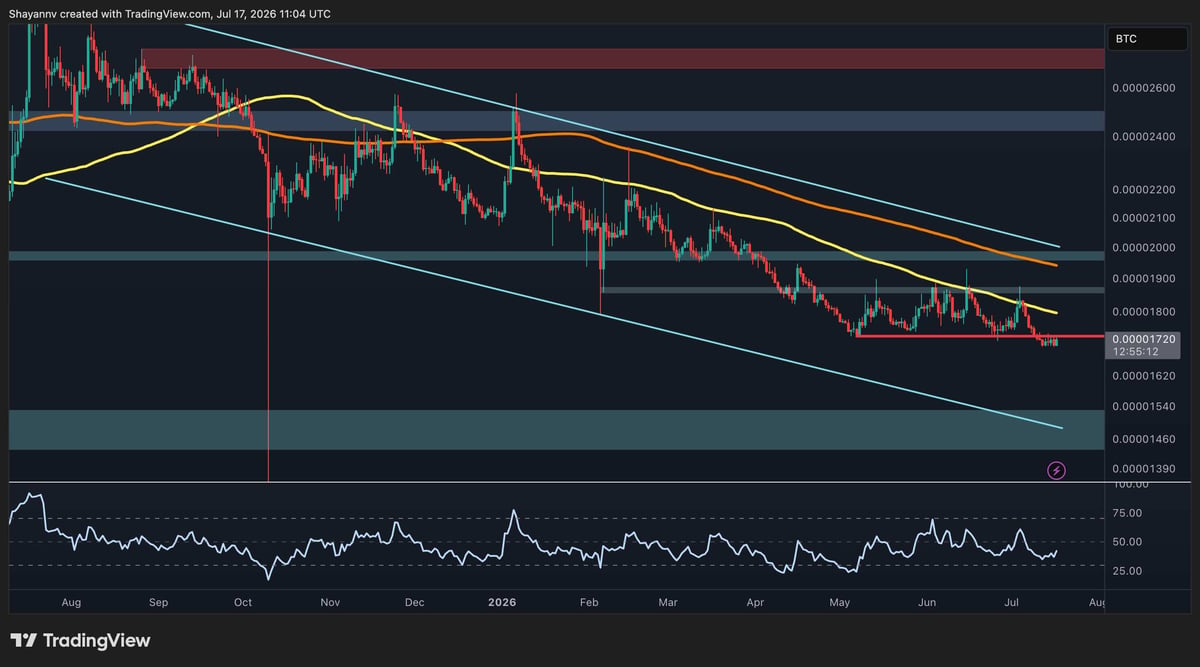
$XRP remains under pressure across both its $USDT and $BTC trading pairs, with the broader market structure still favoring sellers. While the token has managed to stabilize above nearby support on the dollar chart, its Bitcoin pair continues to print lower highs and lower lows, highlighting persistent relative weakness.
Ripple Price Analysis: The $USDT Pair
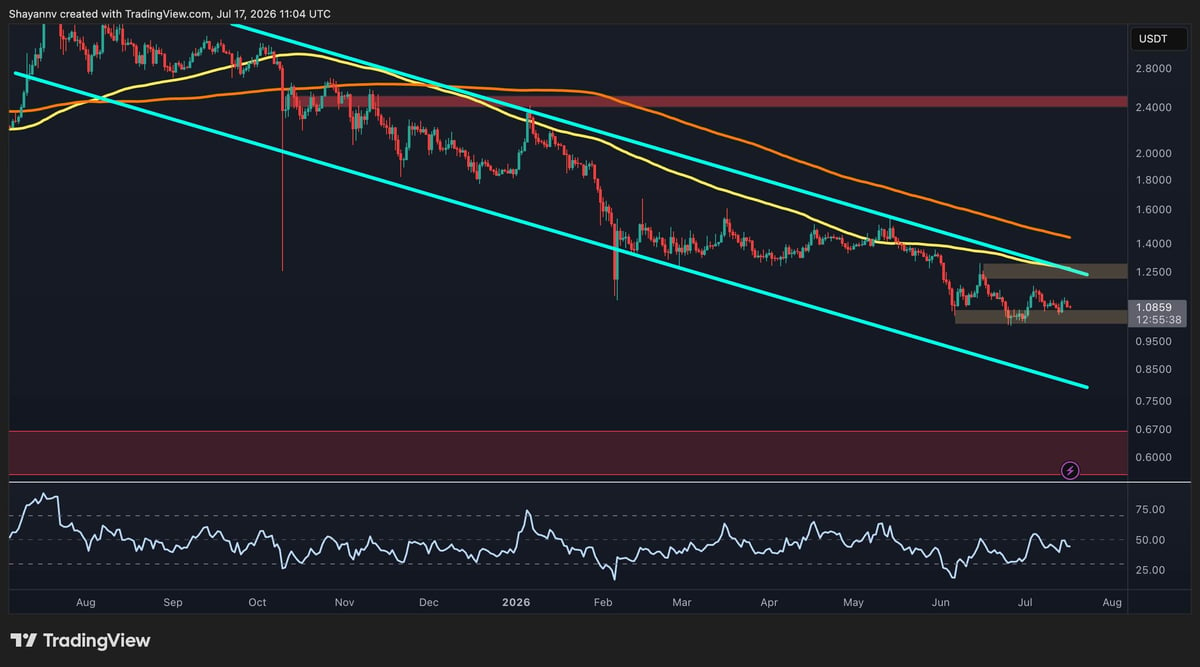
The daily chart shows $XRP trading around $1.08 after an extended decline within a well-defined descending channel. Although the asset has recently moved sideways instead of extending its losses, the broader trend remains bearish as it continues to trade below both the 100-day and 200-day moving averages. These levels are also sloping downward, reinforcing the prevailing negative momentum.
Following the sharp breakdown in June, $XRP has established a consolidation range between the $1 support zone and the $1.25 resistance area. Buyers have repeatedly defended the lower boundary, but every recovery attempt has been rejected before reclaiming the declining 100-day moving average or breaking above the channel’s higher boundary, indicating that bullish momentum remains limited.