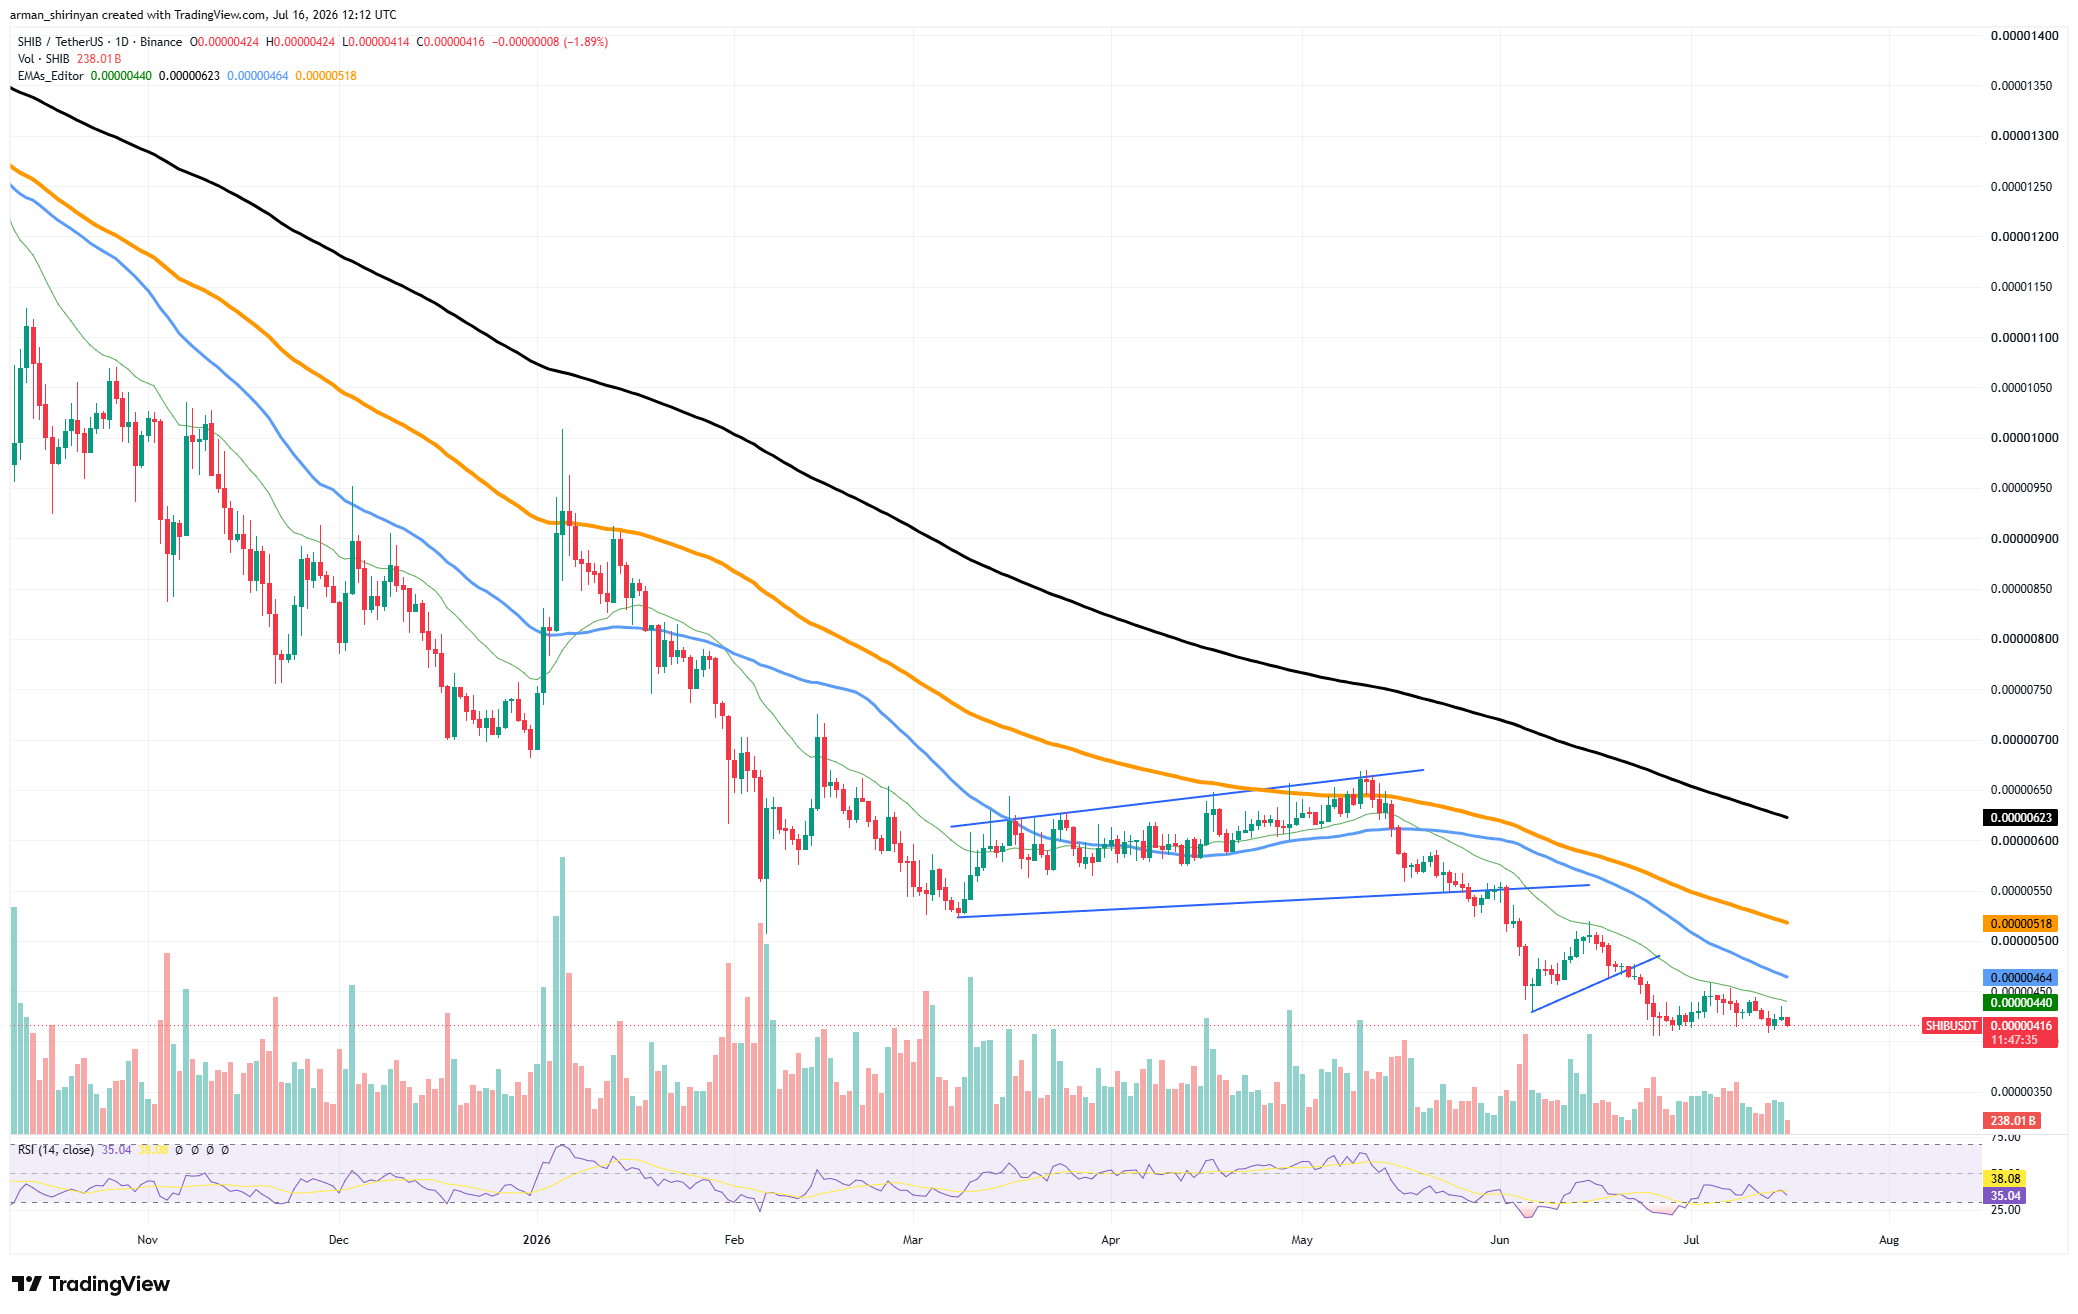
Stronger spot flows have not yet resulted in a strong price reversal, though. $SHIB is still below the daily chart's major exponential moving averages. The 50-day EMA is located around $0.00000464, and the 20-day EMA is close to $0.00000440. The 200-day EMA at $0.00000623 and the 100-day EMA at $0.00000518 show more significant resistance. Because of this structure, the overall trend remains negative.
$SHIB returned to the lower end of its current trading range after failing to maintain its June rebound. $SHIB is in the vicinity of oversold territory with the Relative Strength Index close to 35, but a reversal has not been confirmed. This implies that selling pressure may be waning, but it also leaves room for another drop. Data on on-chain exchanges is still inconsistent. While overall exchange netflow decreased by 0.18%, exchange reserves only increased by 0.03%.
Risks tied to inflows
Concurrently, the average seven-day exchange inflow increased by 8.25%. When tokens move onto exchanges, higher inflows may indicate greater selling risk, which would partially offset the positive spot-flow increase.
Buyers must push the token above $0.00000440 and then recover $0.00000464 in order for $SHIB's price health to significantly improve. Stronger spot flows suggest accumulation interest but not a proven recovery until that point. $SHIB would be vulnerable to another move toward the $0.00000400 area if it lost the most recent floor near $0.00000410.

 u.today