
 coinedition.com
Solana has generated its first SuperTrend buy signal since October, according to cryptocurrency analyst Ali Charts, after the token’s ATR trailing stop moved below its price, a technical indicator some traders view as a sign that momentum may be improving.
“SOLANA TURNED BULLISH,” Ali Charts wrote in a post on X. He said continued buying could lift Solana toward $96 and potentially $121, while noting that the $60 level remains key support. A move below that price would invalidate the bullish outlook, according to the analyst.
SOLANA TURNED BULLISH
— Ali Charts (@alicharts) July 15, 2026
The ATR trailing stop has flipped below price, marking the first SuperTrend buy signal since October 10.
If buying pressure continues to build, $SOL could rally toward $96 or even $121. However, $60 remains the key level to watch.
A break below that… https://t.co/Femtlawn2r pic.twitter.com/pJSFngWZiN
SuperTrend Signal Draws Market Attention
Ali Charts’ chart shows Solana has rebounded from its recent lows after falling from more than $240 earlier this year. The token found support around the $60 to $65 range in June, where selling pressure eased and prices began to recover.
The signal appeared as Solana rebounded from the $60 to $65 support zone, where selling pressure eased in June. Even so, Solana remains below several key resistance levels.
Based on Fibonacci retracement levels, the first area of resistance is around $95.95, followed by about $101.64. Additional resistance levels are near $133 and $150.
Support Levels in Focus
Trader BitGuru said Solana is testing a key support level after its recent pullback, even as market sentiment remains bearish.
“Most traders are bearish on $SOL but price is now testing a key support zone after a steady pullback,” BitGuru wrote in a post on X.
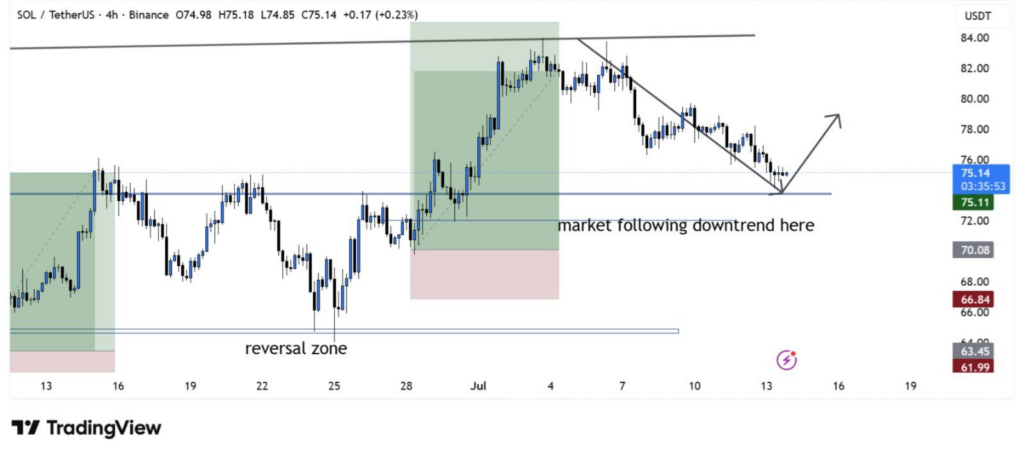
BitGuru said that the support between $74 and $75 could help stabilize the token and pave the way for a move toward the $80 to $84 resistance area. A sustained drop below $73 would weaken that outlook.
Momentum Signals Mixed Outlook
TradingView data shows Solana trading near $77 after recovering from its June lows. The token has yet to break above the $80 to $82 resistance area.
Technical indicators offer mixed signals. The Moving Average Convergence Divergence (MACD) remains above zero, although it has crossed below its signal line, a sign that upward momentum may be easing.
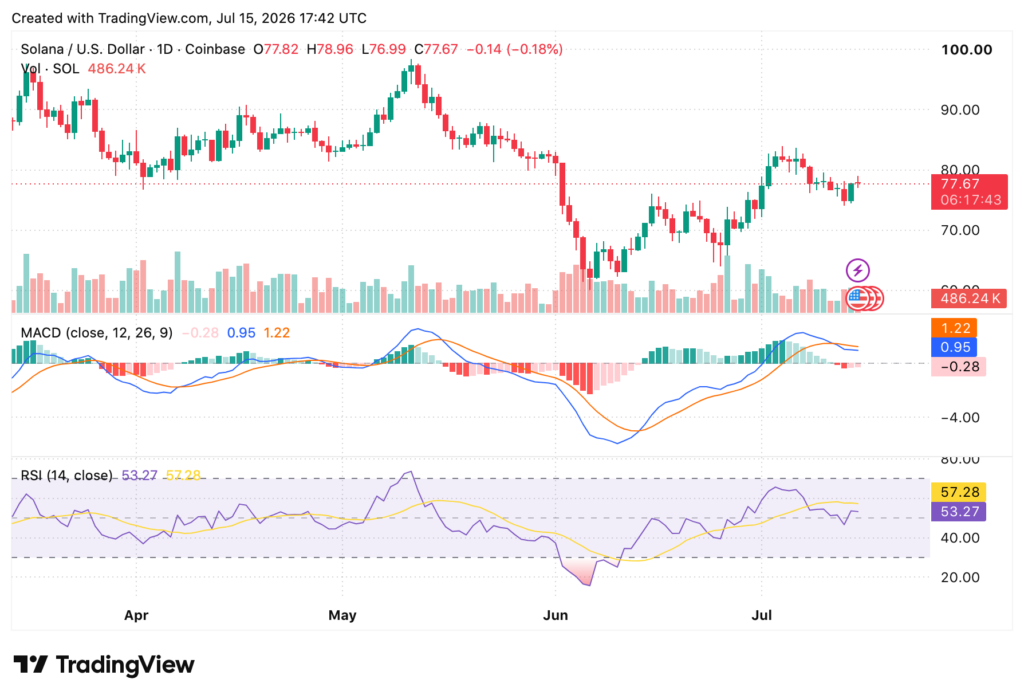
The Relative Strength Index stands at about 53, indicating neither overbought nor oversold conditions. Solana’s next move is likely to depend on whether it can break above nearby resistance or hold its current support levels.
Related: Ethereum Price Holds Near $1,900 as Technical Signals Surge