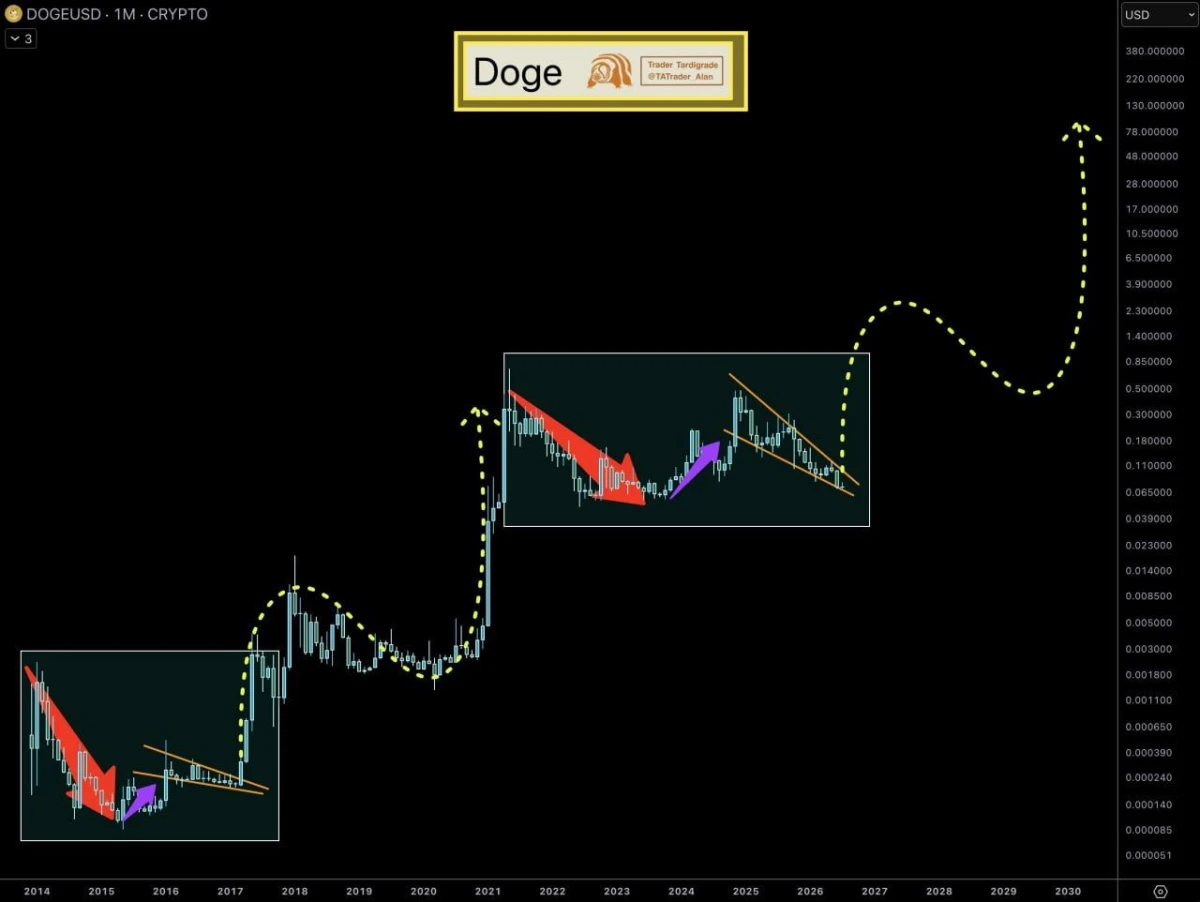
$DOGE monthly chart. Source: Trader Tardigrade/X
The chart breaks the structure into four parts: a bearish decline, a mild recovery, a falling wedge and then a projected breakout. Trader Tardigrade argues that the 2021-2026 sequence is closely matching the pattern seen between 2014 and 2017, which later led to Dogecoin’s explosive 2017-2021 advance.
The main focus now is the falling wedge, which is often watched as a possible reversal pattern when price compresses into lower highs and lower lows. If $DOGE breaks out of that wedge and holds the move, it would strengthen the case that the current cycle is entering its next bullish phase.
Still, the comparison remains a pattern-based projection, not a confirmed breakout. Dogecoin would need to clear wedge resistance and start building stronger monthly highs before the bullish scenario gains more technical support.
Dogecoin Breaks Support as Bearish Pressure Builds
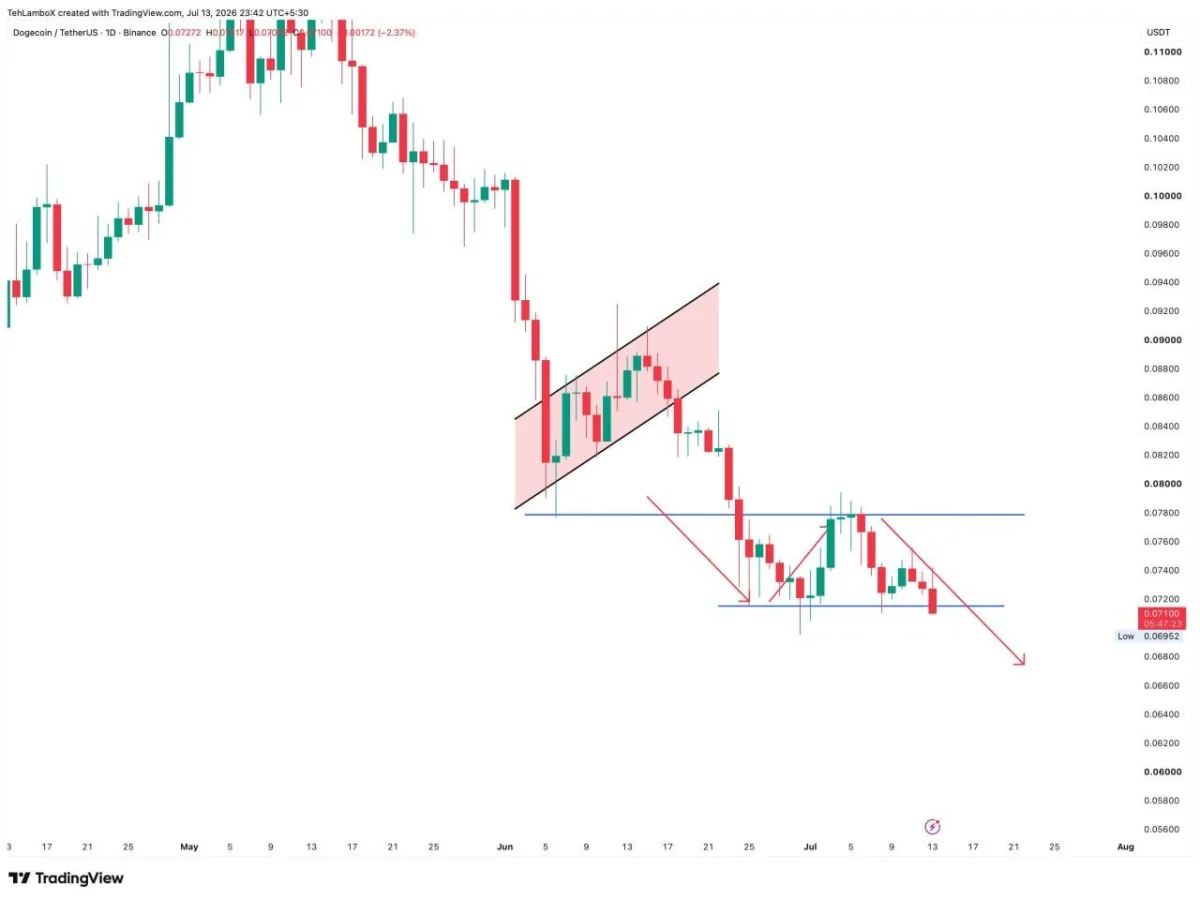
Dogecoin has fallen below a key daily support level after another rejection near $0.078. The breakdown keeps sellers in control and raises the risk of further losses before buyers attempt a recovery.
$DOGE daily chart. Source: Team LAMBO/X
The chart shows $DOGE previously breaking below a rising channel, confirming that the earlier recovery had failed. Price then moved into a narrow range between roughly $0.0715 and $0.078, but buyers could not reclaim the upper boundary.
The latest move below $0.0715 weakens that range and suggests support may now turn into resistance. A daily close below the level could bring $0.068 into focus, followed by the broader $0.064-$0.066 area if selling pressure continues.
A brief rebound remains possible after the breakdown, but $DOGE would need to recover $0.0715 quickly to reduce the immediate downside risk. The bearish structure would only improve more clearly if price later reclaims and holds above $0.078.

 coinpaper.com