
 thecryptobasic.com
$XRP has reached its breakout retest point, looking to defend an important support level that could determine its next major move.
$XRP currently changes hands at $1.06, which puts it close to $0.9539, the exact price where it broke out of a six-year symmetrical triangle in 2024. This level could decide whether the broader bullish trend stays intact or gives way to a deeper correction.
Essentially, the $0.9539 area marked the breakout point that ended a long period of consolidation and started the rally that pushed $XRP to $3.6 last July.
As the price moves back toward that area, it remains to be seen if buyers can defend it. A successful defense would strengthen the current market structure, but a failure could signal that the upsurge is losing support.
$XRP 6-Year Triangle Breakout
Notably, $XRP spent more than six years moving inside a large symmetrical triangle after reaching its cycle high during 2017 and 2018. Throughout this period, the chart formed five major pivot points, labeled A, B, C, D, and E, as the trading range became increasingly narrow.
However, the structure changed when $XRP broke above the triangle in 2024 at around $0.95398. This breakout started a five-wave impulse move that carried the token to a high of $3.3 by January 2025.
After completing the upsurge, the price pulled back toward the $2 area before recovering to the July 2025 all-time high of $3.66. From there, $XRP has now corrected to the same breakout area.
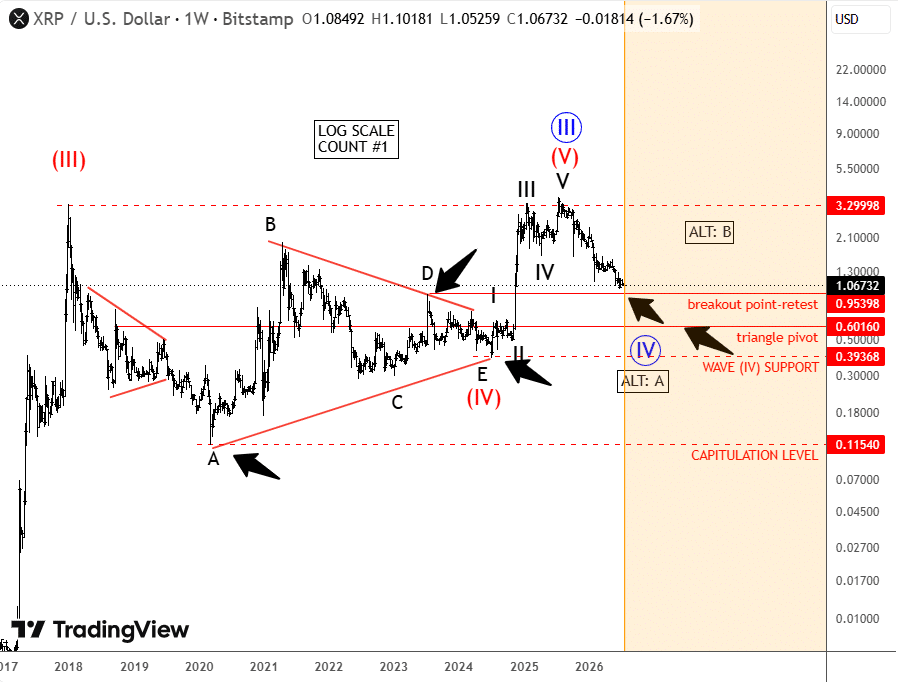
Such a correction often serves as an important test. Markets frequently return to previous breakout levels to see whether old resistance can become new support. If $XRP holds above this level, it will confirm that the breakout remains valid. If it falls below it, further downside could play out.
$XRP Could Face More Downside Before Possible Reversal
Meanwhile, the 4-hour chart shows that $XRP is trading inside a red symmetrical channel, where an ending diagonal appears to be developing. The pattern contains five overlapping sub-waves, and the fifth wave is still in progress.
Current projections suggest that the final leg of this pattern could take $XRP into the $0.80 to $0.90 range before it finishes. Ending diagonals usually form near the end of a decline and suggest that selling pressure is fading. Once they are complete, they can lead to a strong recovery.
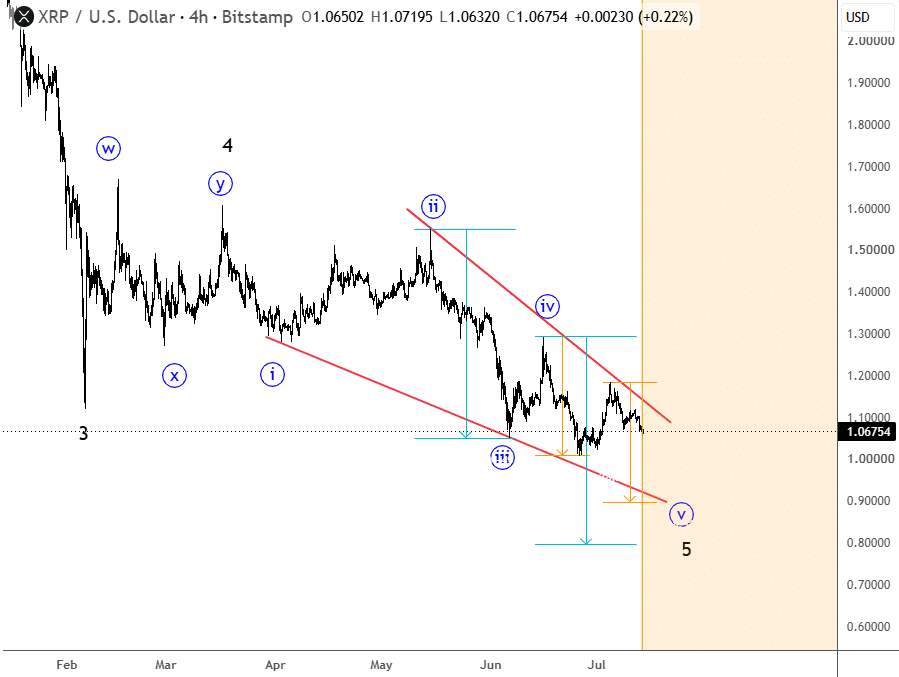
However, for now, the pattern remains unfinished. This means $XRP could still move lower in the short term before buyers attempt to regain control.
Important $XRP Price Levels
The first support area sits between $1.00 and $0.95398. If $XRP drops below this range, the next support lies between $0.80 and $0.90, which aligns with the projected end of the current ending diagonal.
A further decline would bring $0.60160 into the picture. This level marks an important pivot from the six-year triangle and could become the next major support for $XRP.
The chart also highlights $0.39368 as the main Wave IV support level. If selling becomes much stronger, $0.11540 would represent the final capitulation target in the current technical outlook.
On the upside, $XRP must first break through resistance between $1.20 and $1.30. If buyers clear that area, the next resistance sits at $1.60, followed by the previous high of $3.29998.