
 invezz.com

$XRP enters the new trading week at a critical point after several days of weakness pushed the token toward an important support zone.
While the broader trend remains under pressure, technical indicators suggest bears may be losing momentum just as traders prepare for a potentially market-moving week on the regulatory front.
At the time of writing, $XRP was trading at $1.08, down 1.2% over the past 24 hours and 5.8% over the last seven days.
Notably, the token has remained within a narrow 24-hour range of $1.07 to $1.10, highlighting a period of consolidation as investors wait for the next catalyst.
$XRP has held above a critical support level
The immediate focus for traders is the $1.07 support level, which represents the 78.6% Fibonacci retracement measured from the recent swing high of $1.29.
This level has become one of the most closely watched price zones because it could determine $XRP's next short-term move.
If buyers continue defending $1.07, the token could attempt a recovery toward $1.11, which aligns with the 38.2% Fibonacci retracement level.
A successful move through that resistance would bring $1.14 into view, with analysts’ projections pointing to another resistance around $1.16.
However, failure to hold the current support would increase downside risk.
A break below $1.07 could expose $XRP to a decline toward the yearly low near $1.01, making the current trading range one of the most important technical zones seen in recent weeks.
Can $XRP break above $1.12 this week?
Although $XRP remains in a short-term downtrend, momentum indicators paint a more balanced picture than price action alone suggests.
The Relative Strength Index (RSI) on the daily chart currently stands at 42.06.
That reading is neither overbought nor oversold, indicating the market is waiting for a fresh catalyst before committing to a clear direction.
The weekly RSI tells a different story. Based on completed weekly candles, the indicator has dropped to 33.62, placing $XRP in oversold territory.
While an oversold reading does not guarantee a rebound, it often reflects weakening selling pressure after an extended decline.
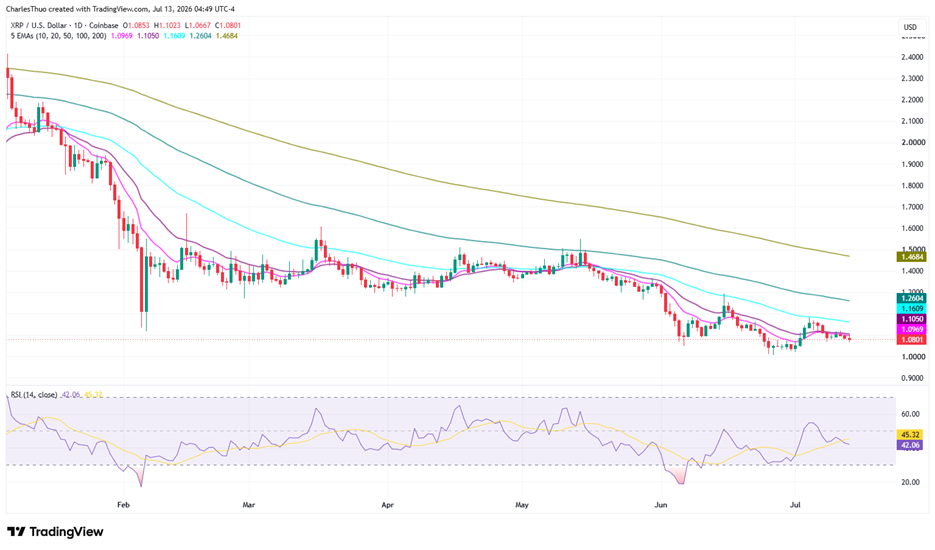
Moving averages continue to favour the bears, with $XRP still below its 10-day, 20-day, 50-day, 100-day and 200-day exponential moving averages (EMAs), leaving each of those levels as overhead resistance.
Trading below the long-term 200-day EMA also shows that broader market pressure has yet to ease.
For sentiment to improve, $XRP would first need to reclaim $1.11 before attempting a sustained move above $1.16.
A daily close above that level would place the next resistance around $1.18.
Regulation could become the catalyst that traders are waiting for
Price action this week may depend as much on regulation as on technical indicators.
Market participants continue to monitor developments surrounding the proposed CLARITY Act in the United States.
The legislation is designed to provide clearer rules for digital assets, an issue that has remained a major focus for the cryptocurrency industry.
Greater regulatory certainty has been viewed as a positive development for companies operating in the sector, including Ripple, whose payment network continues expanding its presence in international markets.
Recent progress outside the United States has also strengthened Ripple's long-term business outlook.
The company has secured authorisation under the Markets in Crypto-Assets (MiCA) framework in Luxembourg, allowing it to expand regulated digital asset services across the European Economic Area.
Ripple has also continued building products around cross-border payments, institutional liquidity and tokenised real-world assets through the $XRP Ledger (XRPL) and its RLUSD stablecoin initiative.
Those developments have helped maintain investor interest despite the recent decline in $XRP's price.