
 coinpedia.org
$XRP’s weekly RSI has dropped below 30 for only the second time in 12 years. The last time this happened, $XRP climbed from below $0.30 to over $3.60, seeing a rally of more than 1,100%.
Now, with $XRP trading near $1.10 again, leaving traders wondering if $XRP is preparing for another big rally.
$XRP Weekly RSI Hits a Rare Historical Signal
Entrepreneur and popular crypto trader Lark Davis pointed out that $XRP’s weekly RSI has fallen into oversold territory only twice since the token launched.
“In 12 years, $XRP has hit oversold on the weekly RSI. Two times. Not five times, not three times—just two times in 12 years.”
According to Davis, the first time it happened was during the 2022 bear market, when $XRP’s weekly RSI dropped to 28.09 after heavy selling pushed the price from $0.8519 to a June 2022 low of $0.2905.
The second time came in last month in June 2026, when the weekly RSI fell to 29.6, marking another historic low. At that time, the $XRP price fell from a high of $1.34 to a low of $1.020.
But the interesting part is, what happened when this rare signal occurred last time.
What Happened the Last Time $XRP Went Oversold?
The previous oversold signal in 2022 turned out to be a major turning point for $XRP. After falling below $0.30, the token gradually recovered, then entered a strong rally that eventually pushed its price above $3.66 in July 2025 during the next bull cycle.
And this rally has now caught traders’ attention, with many watching the recent oversold signal as a hope for another potential rally.
Perhaps Davis also warned that the signal alone is not enough to confirm a bottom. He said,
“That doesn’t guarantee the same outcome this time. There are no guarantees in markets. But when a signal this rare appears on an asset with this much institutional attention and retail participation, I think it demands some consideration.”
$XRP Monthly Chart Hints At Upcoming Bullish Rally
Looking at the $XRP monthly chart, it shows early signs that the selling pressure may be slowing down.
According to Coinpedia’s analysis, $XRP appears to have completed the fourth leg of its correction and could now be preparing for a fifth wave higher.
As of now, $XRP is holding near the $1.10 level, while the lower Bollinger Band sits around $0.80. At the same time, the RSI has recovered to around 47, climbing back from oversold levels, showing buyers are slowly returning.
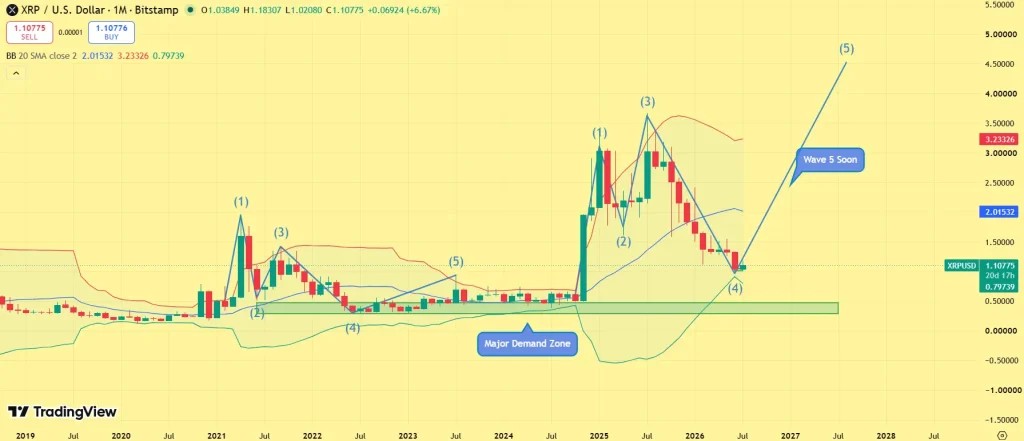
However, the biggest hurdle is still the 20-month moving average near $2.01. $XRP must break and hold above this level before a bigger trend reversal can be confirmed.
In the short term, the first resistance stands between $1.18 and $1.20, where sellers are expected to become active again.