
 thecryptobasic.com
Cardano recently formed a bullish divergence involving the daily RSI, suggesting that the selling pressure may be weakening.
Cardano ($ADA) remains under pressure, trading at $0.16697 and down 4.19% on the day. However, a major technical signal has appeared on the daily chart, suggesting that bearish momentum may be losing strength.
The signal comes from a bullish divergence between $ADA’s price and the Relative Strength Index (RSI). While this pattern does not confirm that the downtrend has ended, it shows that sellers are losing momentum even as the price continues to make lower lows.
Cardano RSI Divergence Indicates Improving Momentum
The bullish divergence developed between two swing lows that formed about three weeks apart. Specifically, on June 8, $ADA dropped to $0.1487, pushing the RSI down to 12.78, an extremely oversold level that reflected heavy selling pressure during the early-June decline.
Later, on June 25, $ADA fell further to $0.1380, creating a lower low on the price chart. However, instead of falling further, the RSI posted a higher low of 25.10 on the same day. This created a bullish divergence, where price makes a lower low but the momentum indicator forms a higher low.
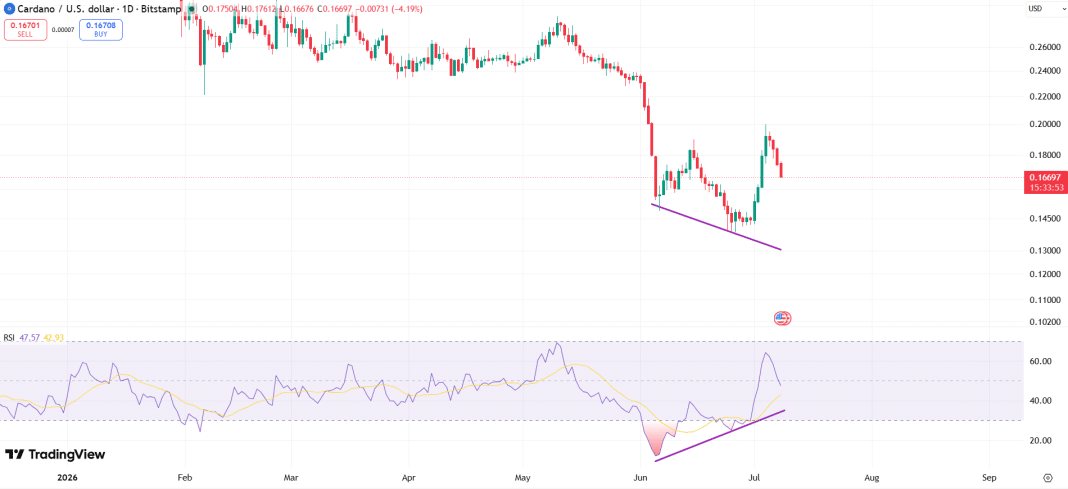
This pattern suggests that sellers are beginning to lose control. Although they managed to push $ADA to a new low between June 8 and June 25, they did so with much weaker momentum.
Since then, the RSI has climbed to 47.57, while its signal line stands at 42.93. An upward trendline now connects the RSI readings of 12.78 and 25.10, confirming the improving momentum. If the RSI moves above 50 and stays there, it would provide stronger confirmation that buyers are now gaining control.
Cardano Fibonacci Levels
Meanwhile, $ADA’s daily chart also shows Fibonacci retracement levels from the swing high of $0.28935 to the June 25 swing low of $0.13800, which also marks the point where the RSI bullish divergence formed. These levels present key support and resistance areas for $ADA.
Right now, $ADA is testing the 0.786 Fibonacci retracement at $0.16169, a level that has served as both support and resistance in recent sessions. Just below it sits the 0.888 retracement at $0.14993, which provides another important support area.
If $ADA closes below that level, the market could revisit the $0.13800 low. A break below that support would then expose the 1.272 Fibonacci extension at $0.11283 and the 1.414 extension at $0.10156, although reaching those levels would likely require a much weaker crypto market overall.
On the upside, $ADA first needs to reclaim the 0.618 Fibonacci retracement at $0.18311 to improve the short-term outlook.
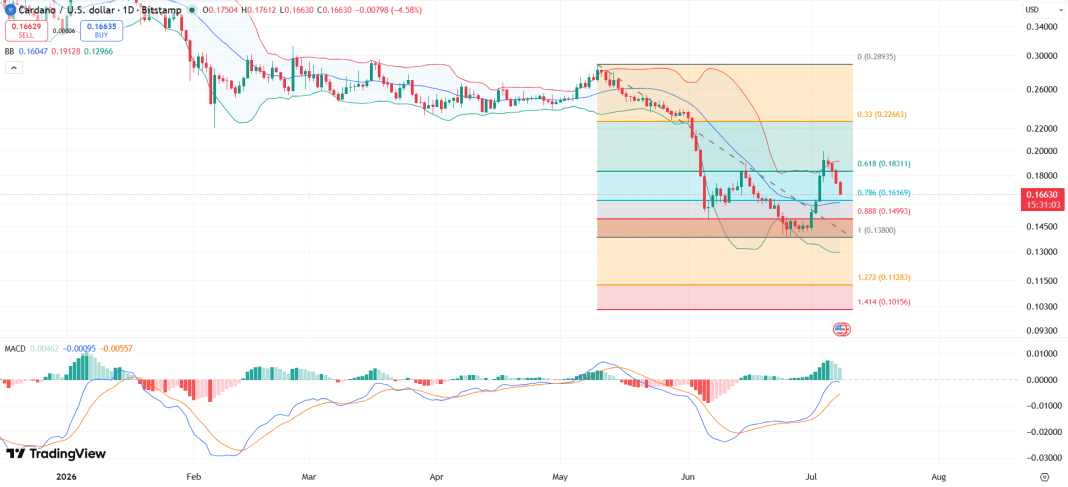
Holding above that level could then open the door to the 0.33 retracement at $0.22663, representing a gain of about 35% from the current price. The previous swing high at $0.28935 remains the major resistance level over the longer term.
MACD and Bollinger Bands Show Weakening Pressure
The Moving Average Convergence Divergence (MACD) also shows improving momentum. The MACD line currently stands at 0.00462, while the signal line sits at -0.00095.
During the sharp sell-off in June, the MACD histogram recorded deeply negative readings. Since then, the histogram has moved closer to the zero line and has begun shifting toward positive territory, showing that bearish momentum continues to weaken despite today’s decline.
Meanwhile, the middle Bollinger band stands at $0.16047, while the upper and lower bands sit at $0.19128 and $0.12966, respectively. $ADA is trading slightly above the middle band, placing it in a neutral position rather than confirming either a breakout or another breakdown.
The upper Bollinger Band at $0.19128 also sits close to the 0.618 Fibonacci retracement at $0.18311, creating a strong resistance area that buyers will need to overcome.
What Could Come Next for Cardano?
In the short term, $0.16169 remains the most important level to watch. $ADA needs to stay above this 0.786 Fibonacci retracement on a daily closing basis to keep the bullish divergence valid.
A drop below the 0.888 retracement at $0.14993 would show that buyers failed to build on the improving momentum and could lead to another test of the June 25 low at $0.13800. If that level breaks, the current bullish setup would lose its validity, and the Fibonacci extension targets could come into focus.
If $ADA holds its ground and the rising RSI trendline remains intact, the first upside target stands at $0.18311, where the 0.618 Fibonacci retracement meets the upper Bollinger Band.
A strong daily close above that level, together with an RSI move above 50 and continued improvement in the MACD, would point to a greater change in market structure and could pave the way for a move toward $0.22663.
Meanwhile, it remains to be seen if the $0.13800 low will prove to be the cycle bottom. The bullish RSI divergence and improving MACD momentum point to that possibility.
However, $ADA still needs to reclaim and hold above the 0.618 Fibonacci retracement at $0.18311 before the broader trend can shift from bearish to bullish. Until then, the RSI divergence is just a promising signal, not the confirmation of a full trend reversal.