
 coinedition.com
Shiba Inu trades at $0.00000429 on July 8, down 2.05%, as an unprecedented Robinhood-driven burn spike hits the blockchain while the chart shows price trapped inside a tightening triangle.
Is $SHIB Approaching A Breakout Or Breakdown From Its Triangle?
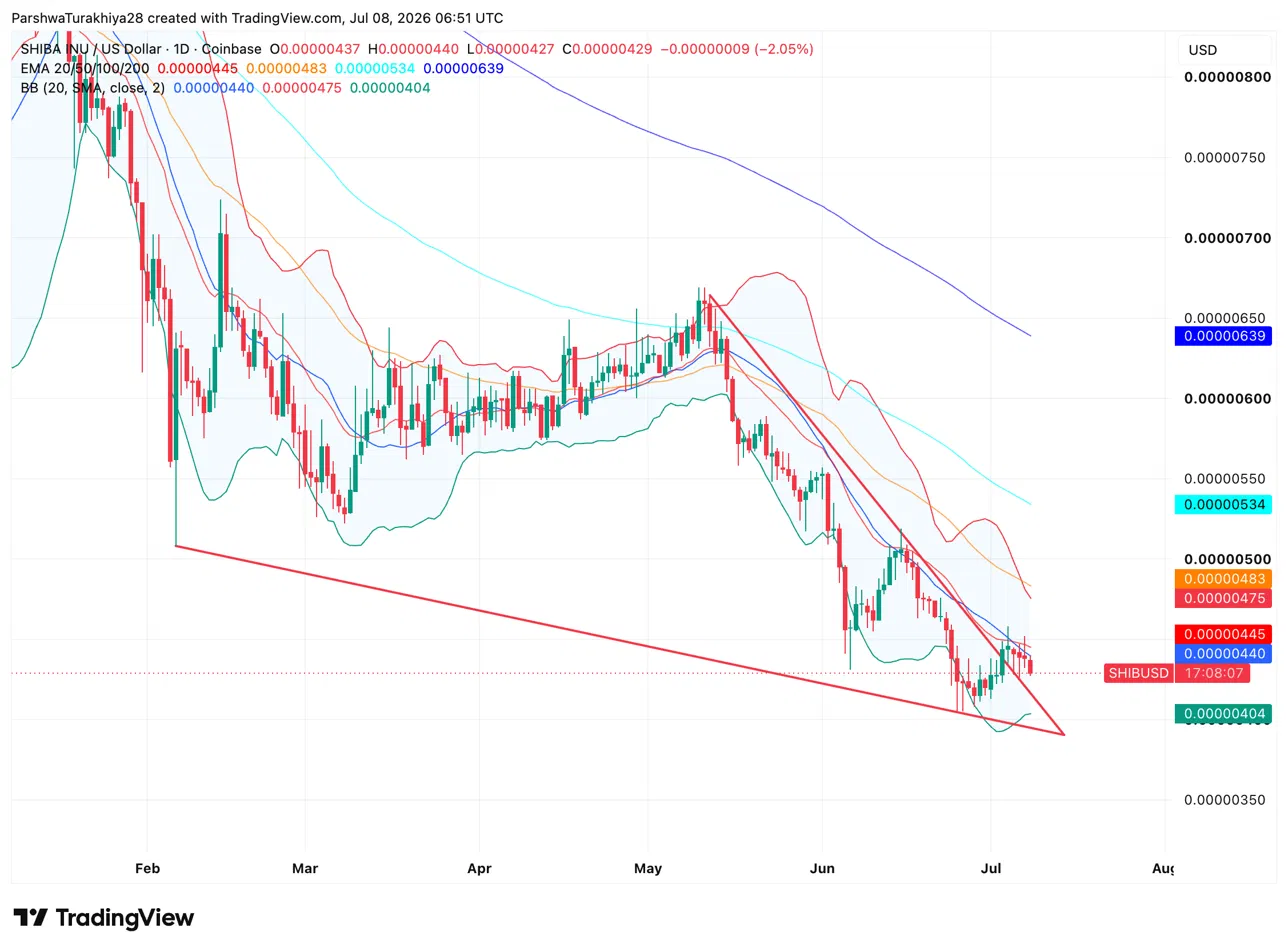
The daily chart shows $SHIB inside a descending triangle that has been forming since May, with lower highs pressing against a flat support line near $0.0000040-$0.0000042. The Bollinger Bands have tightened sharply, with the upper band at $0.00000475 and the lower band at $0.00000404, one of the most compressed readings since February. Tight bands precede sharp directional moves, though the direction isn’t determined by compression alone.
Related: EVAA Protocol Price Prediction: EVAA Rally Targets $4—Can It Extend Gains After a 250% Weekly Rally?
Every EMA sits above price: the 20-day at $0.00000445, the 50-day at $0.00000483, the 100-day at $0.00000534 and the 200-day at $0.00000639, confirming the broader trend remains bearish.
What Are The Key Support And Resistance Levels For $SHIB Today?
- Support at $0.00000404 on the lower BB and the triangle’s flat base near $0.0000040
- Resistance at $0.00000445 on the 20-day EMA, then $0.00000475 on the upper BB
Why Did Robinhood Just Burn 109 Million $SHIB?
The latest burns table shows Robinhood sent 109,659,248 $SHIB to the dead address in a single transaction, the largest individual burn recorded in recent weeks by a significant margin. Two additional smaller burns of around 460,000 $SHIB each followed from the same sender. The Robinhood burns appear to be tied to trading fee collection, consistent with how some platforms route a portion of transaction fees toward $SHIB destruction.
The on-chain impact was immediate. The 24-hour burn rate jumped 3,096.85%, with the spike visible on the burn activity chart as a vertical move near the 01:00 mark that dwarfed everything seen earlier in the session. The 7-day burn rate rose 680.07%, with the cumulative weekly chart showing burns essentially flat through July 6 before a near-vertical climb on July 8.
What Do $SHIB Derivatives Show About Current Sentiment?
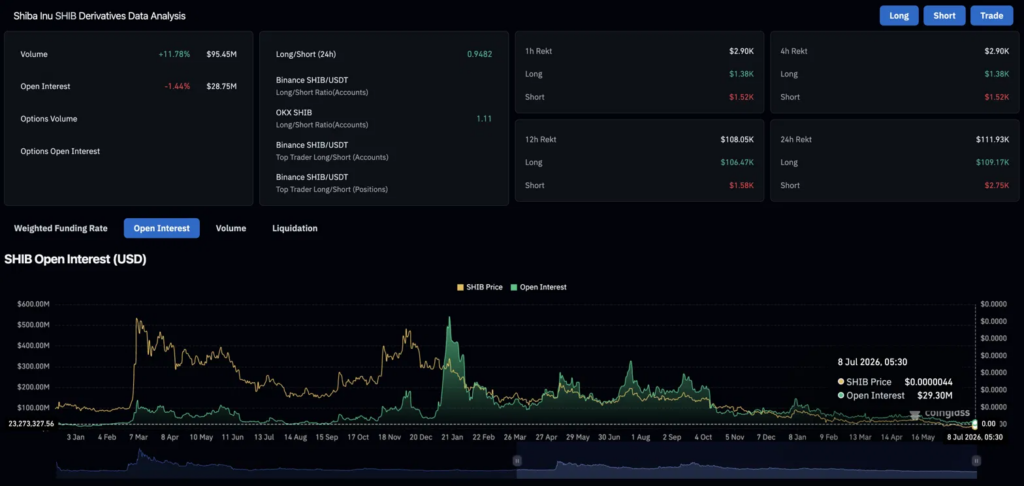
$SHIB derivatives data points to a market actively closing positions, not building new ones. Trading volume climbed 11.78% to $95.45 million over the past 24 hours while open interest declined 1.44% to $28.75 million — a divergence that signals exits rather than fresh leveraged exposure. The long/short ratio sits at 0.9482, slightly net-short, with total liquidations over 24 hours amounting to just $111.93K. Long positions absorbed $109.17K of those losses against only $2.75K on the short side — confirming that bears face no meaningful squeeze pressure at current levels.
The broader context sharpens the picture. $SHIB open interest has collapsed roughly 94% from a peak near $500 million in early 2025 to just $28.75 million, the lowest level in approximately two years. Rising volume alongside shrinking OI, a short-heavy ratio, and one-sided liquidations all point to the same conclusion: the $SHIB derivatives market is de-leveraging, sellers hold the structural advantage, and no meaningful speculative demand is entering at current prices.
$SHIB Price Prediction: Upside and Downside Targets
- Upside case: The Robinhood burn spike sustains momentum, $SHIB breaks the triangle’s upper trendline and clears the 20-day EMA at $0.00000445, targeting $0.00000475-$0.00000500.
- Downside case: The triangle’s flat base near $0.0000040 breaks, the lower Bollinger Band at $0.00000404 fails to hold, and $SHIB slides toward $0.00000350.