
 invezz.com

$SOL pauses after a 14% weekly rally, but rising institutional interest, strengthening derivatives data, and growing on-chain activity continue to support the case for further upside.
While the recent rally has temporarily stalled around the $81.63 resistance level, improving institutional participation, stronger derivatives positioning, and expanding on-chain activity suggest the broader bullish trend remains intact.
As long as $SOL continues to hold above key support levels, the cryptocurrency could be positioned for another attempt at higher prices.
Spot Solana ETFs return to positive flows
Institutional sentiment toward Solana appears to be improving.
According to CoinGlass data, US-listed spot Solana exchange-traded funds (ETFs) attracted $5.8 million in net inflows during the previous week, reversing the prior week's $1.8 million in net outflows.
The return to positive flows indicates renewed investor interest, and continued inflows could provide additional support for $SOL in the weeks ahead.
Network activity continues to strengthen across the Solana ecosystem.
According to Solana's official X account, tokenized asset spot trading volume reached $5.7 billion during the second quarter, more than doubling from $2.7 billion recorded in the first quarter.
The increase reflects growing adoption of tokenized assets on the network while highlighting expanding institutional participation and increasing demand for Solana-based applications.
The derivatives market also reinforces the bullish narrative.
Solana futures Open Interest (OI) climbed to $5.8 billion over the weekend, marking its highest level since mid-May before easing slightly to approximately $5.6 billion on Monday.
Higher open interest typically signals increasing trader participation and growing conviction behind the prevailing market trend.
Funding rates have also shifted in favor of buyers.
According to CoinGlass, Solana's funding rate turned positive on Sunday and stood at 0.0081% on Monday, indicating that traders holding long positions are paying those holding short positions—a sign that bullish sentiment is strengthening.
Solana price analysis: Bulls face resistance at the 100-day EMA
Technically, Solana remains in a constructive position despite Monday's pullback.
The price is currently trading above both the 50-day EMA at $76.41 and the 50% Fibonacci retracement level at $79.27, indicating buyers continue to defend important support.
However, the rally faces immediate resistance at the 100-day EMA near $81.63, followed by the 61.8% Fibonacci retracement level at $83.78.
Momentum indicators continue to favor buyers.
The Relative Strength Index (RSI) remains close to 60, suggesting positive momentum without entering overbought territory.
Meanwhile, the Moving Average Convergence Divergence (MACD) remains in bullish territory, reinforcing the current upward trend.
A sustained close above the 100-day EMA would strengthen the bullish outlook and potentially trigger a move toward the next major support at $90.21.
Beyond that, the next major resistance levels are located near $96.19, followed closely by the 200-day EMA around $96.73.
However, if the bears regain control, the first area of support sits near the $79.27 level. Additional support is found around $77.06 and the 50-day EMA at $76.41.
If those levels fail to hold, sellers could target the recent swing low at $74.75, with deeper downside support located near $69.16 and $60.13.
Although Solana has paused following last week's strong rally, the broader technical picture remains favorable.
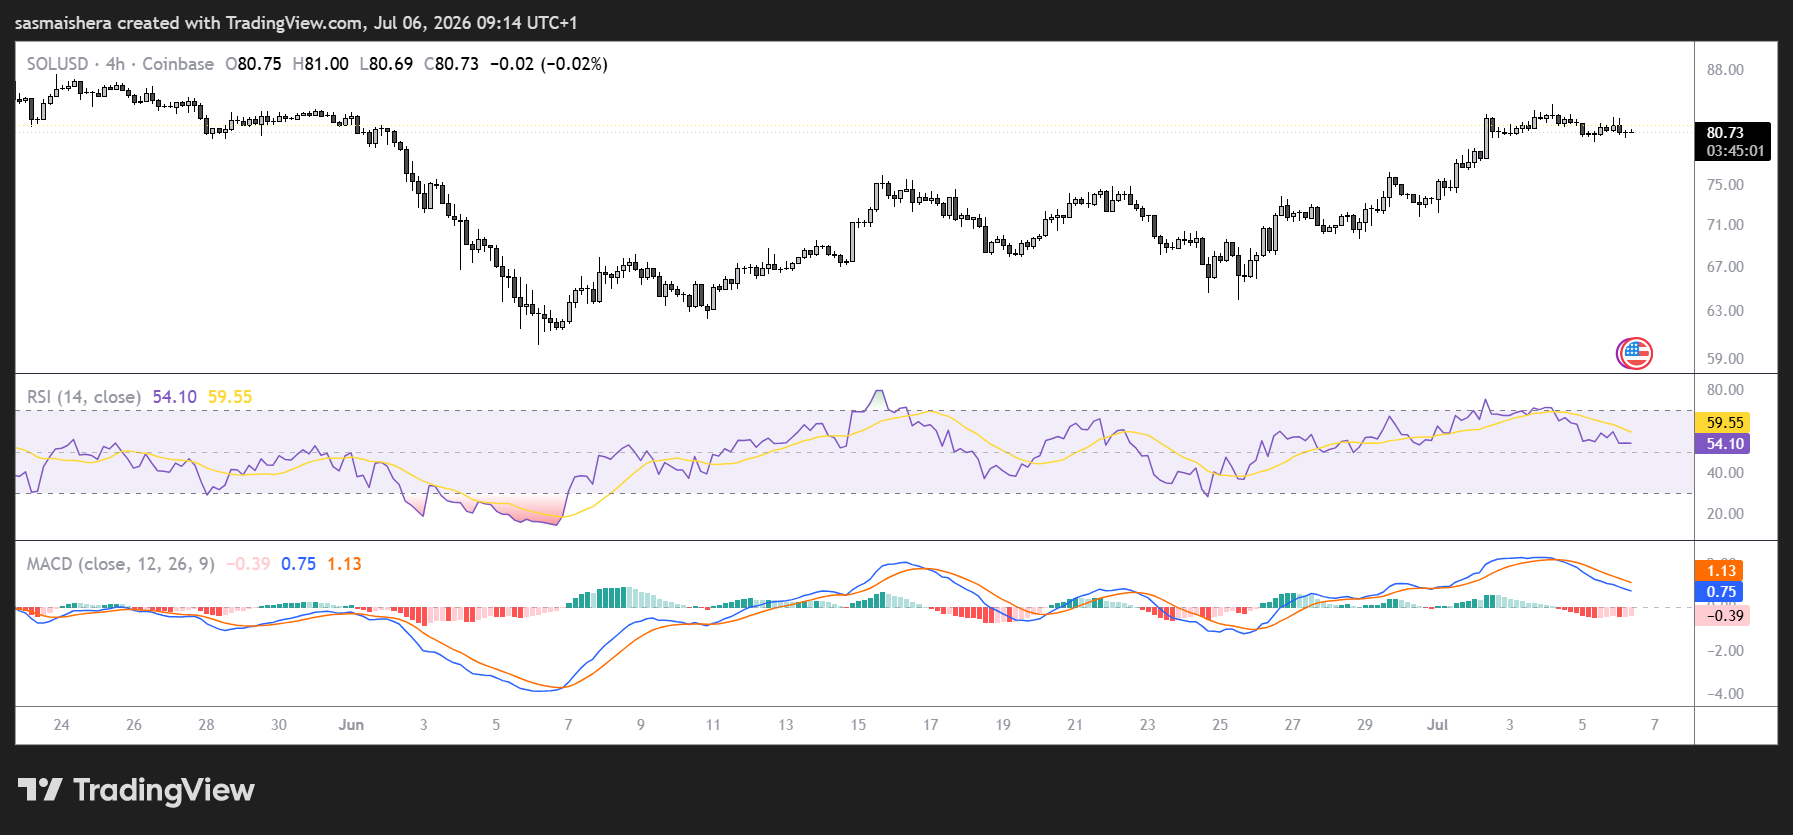
Renewed ETF inflows, expanding on-chain activity, rising futures participation, and positive funding rates all point to improving market sentiment.
If buyers can push $SOL above the resistance cluster between $81.63 and $83.78, the cryptocurrency could extend its recovery toward the $90 and $96 resistance zones in the coming sessions.