
 thecryptobasic.com
$XRP has gradually erased its bull run gains over the past eleven months and now trades at a crucial Fibonacci level that holds significance to its bull structure.
$XRP enters July 2026 at what many see as its most important technical point since the start of the bull run. The asset had earlier climbed from about $1.05 in the second week of November 2024 into an all-time high of $3.66 in July 2025.
However, since then, it has spent eleven months gradually losing these gains. Now, $XRP trades at $1.1, sitting just above the 1.0 Fibonacci retracement level at $1.00795.
This level is important because it marks a full return to the starting point of the entire rally. Although the first weekly candle of July shows a 5.07% gain, the broader chart structure suggests that the situation is still fragile.
The Final Fibonacci Support for $XRP
Toward the end of June, $XRP fell to $1.009, its strongest test of the $1 level since November 2024. Slightly below this, the 1.0 Fibonacci level at $1.00795 reflects a complete retracement from the cycle low to the July 2025 peak.
Throughout the eleven-month decline since August 2025, $XRP lost key Fibonacci levels one after another. The 0.382 level at $2.65117, the 0.618 at $2.02366, the 0.786 at $1.57696, and the 0.888 at $1.30575 all broke down and flipped to resistance.
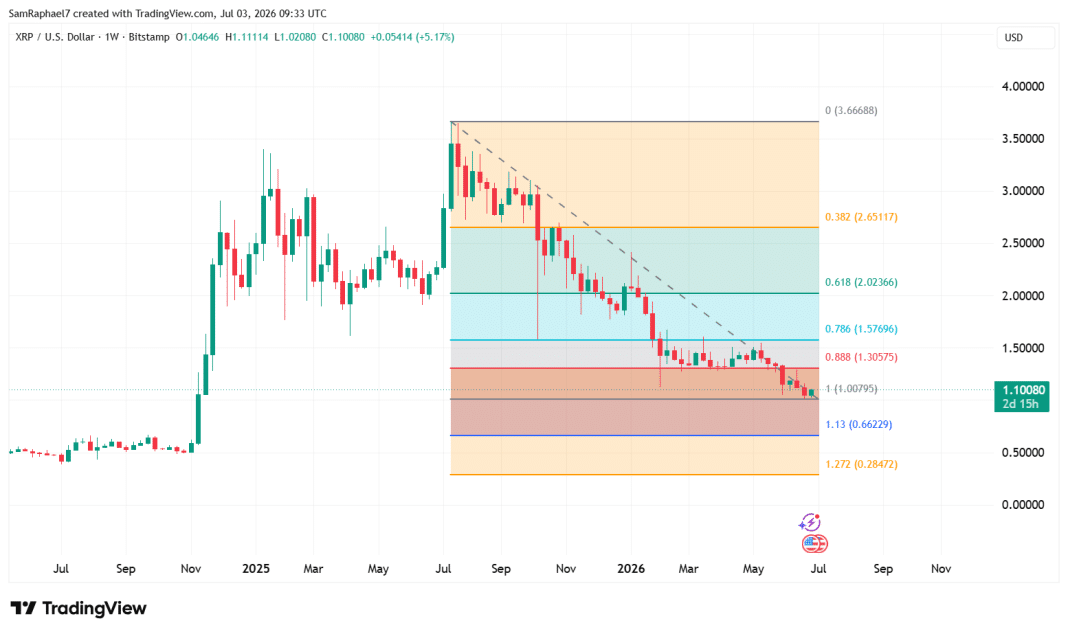
If $XRP manages to hold above $1.00795 on a weekly closing basis, it could give buyers a base to build from. However, if it drops below this level, bears will have an opportunity to start targeting sub-$1 levels.
Specifically, the $0.8 to $0.9 range could act as the immediate defense. Below this, the 1.13 extension at $0.66229 becomes the next support, followed by the 1.272 extension at $0.28472. These levels suggest possible declines of 82% and 92% from the July 2025 peak.
Downtrend Still in Control
Meanwhile, a descending trendline that started from the July 2025 peak continues to limit every recovery attempt and confirms that the downtrend remains in control despite the mild July rebound.
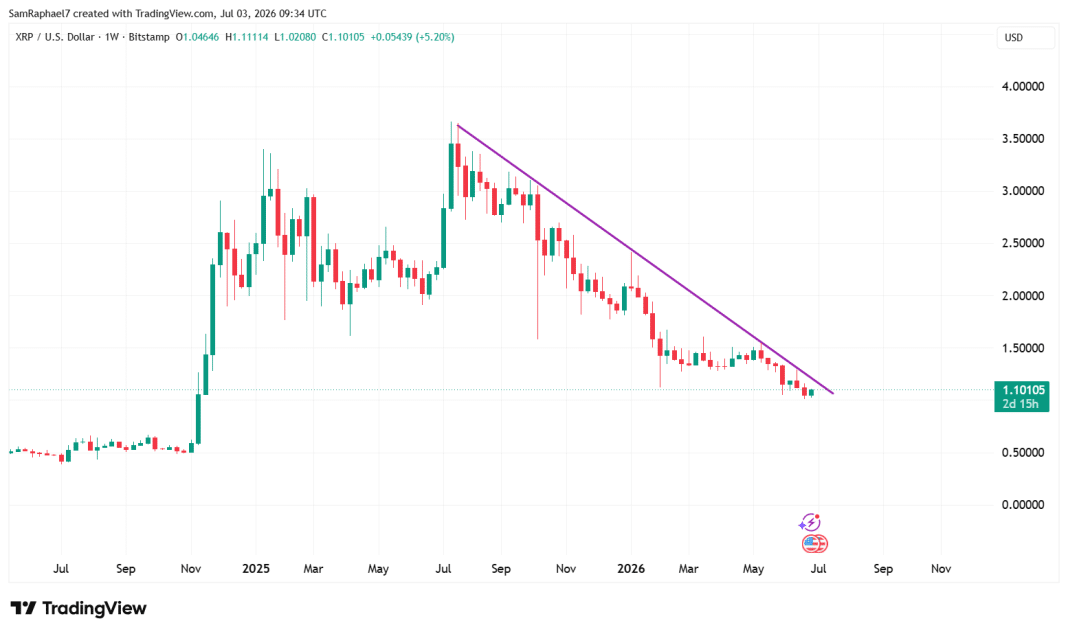
$XRP recently reached a weekly high of $1.11, as buyers started testing the resistance at the trendline. However, the price pulled back slightly to $1.09969, leaving the breakout uncertain. A confirmed weekly close above this trendline would be the first sign of a shift in structure since the peak.
So far, this trendline has held firm. Every bounce since August 2025 has failed at or before reaching it. Until $XRP breaks above it, the overall trend remains bearish.
$XRP Faces Resistance from the Ichimoku Cloud
Also, the weekly Ichimoku Cloud presents further resistance above the current price. The Tenkan-sen stands at $1.27885, while the Kijun-sen is at $1.71205. Both are well above current levels, showing that momentum has not yet turned positive.
For any recovery to continue, $XRP must first move above the Tenkan-sen at $1.27885 and then push toward the Kijun-sen at $1.71205. Only after that can it begin to challenge the cloud itself.
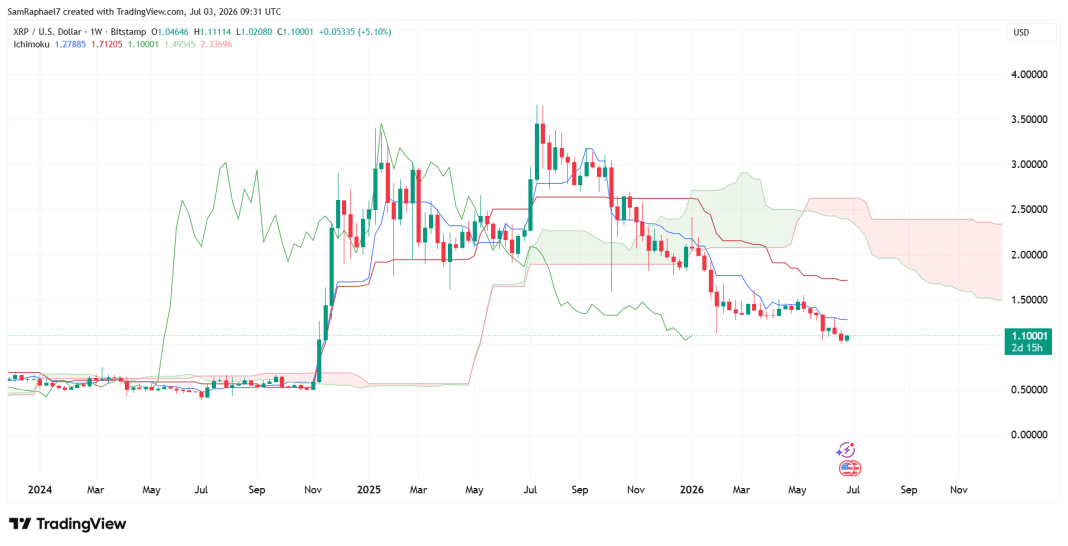
The projected cloud spans from Senkou Span A at $1.49545 to Senkou Span B at $2.33696, covering a wide range of $0.84. This wide zone shows strong resistance ahead.
For $XRP to break above the cloud at $2.33696, it would need to overcome all remaining Fibonacci levels, move above four major moving averages, and clear the entire cloud structure. This makes a near-term move toward the 0.382 level at $2.65117 a very ambitious scenario.
Early July Signals and What Comes Next
The first July weekly candle shows some positive signs. $XRP opened at $1.04646, reached a high of $1.11, and now trades at $1.1.
On-chain data also shows the market boasts some strength. Specifically, $XRP spot ETF inflows have stayed positive for eight straight weeks. In the week of June 26, inflows reached $22.99 million, bringing total net inflows to $1.47 billion.
Meanwhile, exchange outflows rose from 40.7 million $XRP on June 22 to around 123 million $XRP in later sessions. This nearly 200% increase suggests that larger players may be accumulating. Still, the market faces substantial risks.
For $XRP to recover, it must move through key resistance levels step by step. The first target is the 0.888 Fibonacci level at $1.30575, which sits close to the Tenkan-sen at $1.27885. After that, the next level to watch is the 0.786 at $1.57696.
However, $XRP still trades below its 20-day EMA at $1.11, 50-day EMA at $1.20, 100-day EMA at $1.31, and 200-day EMA at $1.52. These levels form a strong barrier that the asset must overcome to confirm any lasting recovery.