Dogecoin is back at a major decision zone as two long-term charts point to the same area of support. One chart shows a multi-year bullish pennant, while the other warns $DOGE may need more sideways action before a stronger reversal can begin.
Dogecoin Chart Shows Bullish Pennant as Price Tests Key Support
Dogecoin is trading near the lower edge of a multi-year bullish pennant, with one analyst arguing the setup may be nearing a reversal point.
The 3-month chart shows $DOGE compressing inside a large pennant pattern since its 2021 surge. Price is now sitting near the ascending lower trendline, a zone the analyst describes as the bottom of the structure.
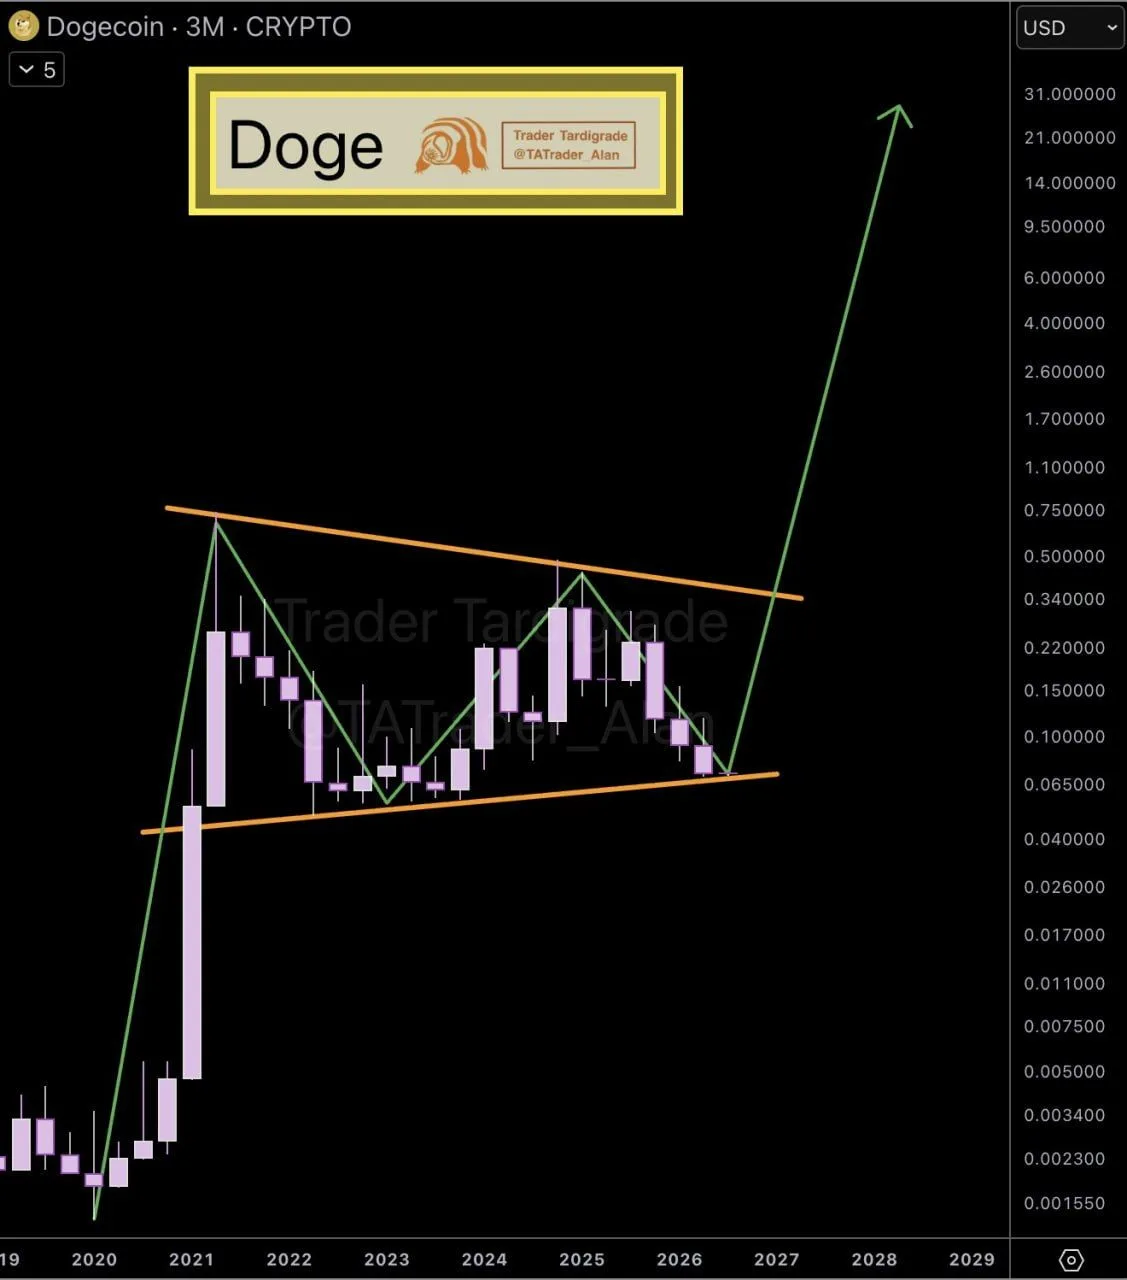
$DOGE 3-month chart. Source: Trader Tardigrade on X, TradingView
That matters because bullish pennants often form before a larger continuation move, especially when price keeps making tighter swings inside converging trendlines. In this case, the chart suggests $DOGE may be trying to hold long-term support before a possible breakout attempt.
The first level to watch is the lower boundary near the current range around $0.06 to $0.07. If buyers defend that area, $DOGE could rebound toward the upper trendline, which appears to come in near the $0.30 to $0.35 zone.
A clean breakout above that resistance would be the real confirmation. If that happens, the pennant structure would support the case for a much larger upside move over time, though the most aggressive targets on the chart remain speculative until price actually breaks out.
The risk is simple: if $DOGE loses the lower trendline support, the bullish pennant setup becomes weaker. That would suggest the pattern is either failing or needs more time to develop.
For now, the chart shows $DOGE at a major decision point. Bulls are watching for support to hold, while traders still need a breakout above resistance before calling for a larger trend reversal.
Dogecoin Nears Major Support as Traders Watch $0.05 Zone
Dogecoin is moving back toward a major long-term support zone, with one analyst watching the $0.05 range for a possible swing-trade setup.
The two-week chart shows $DOGE breaking below the previous support area around $0.080. That move puts the green support zone between roughly $0.055 and $0.065 back in focus.
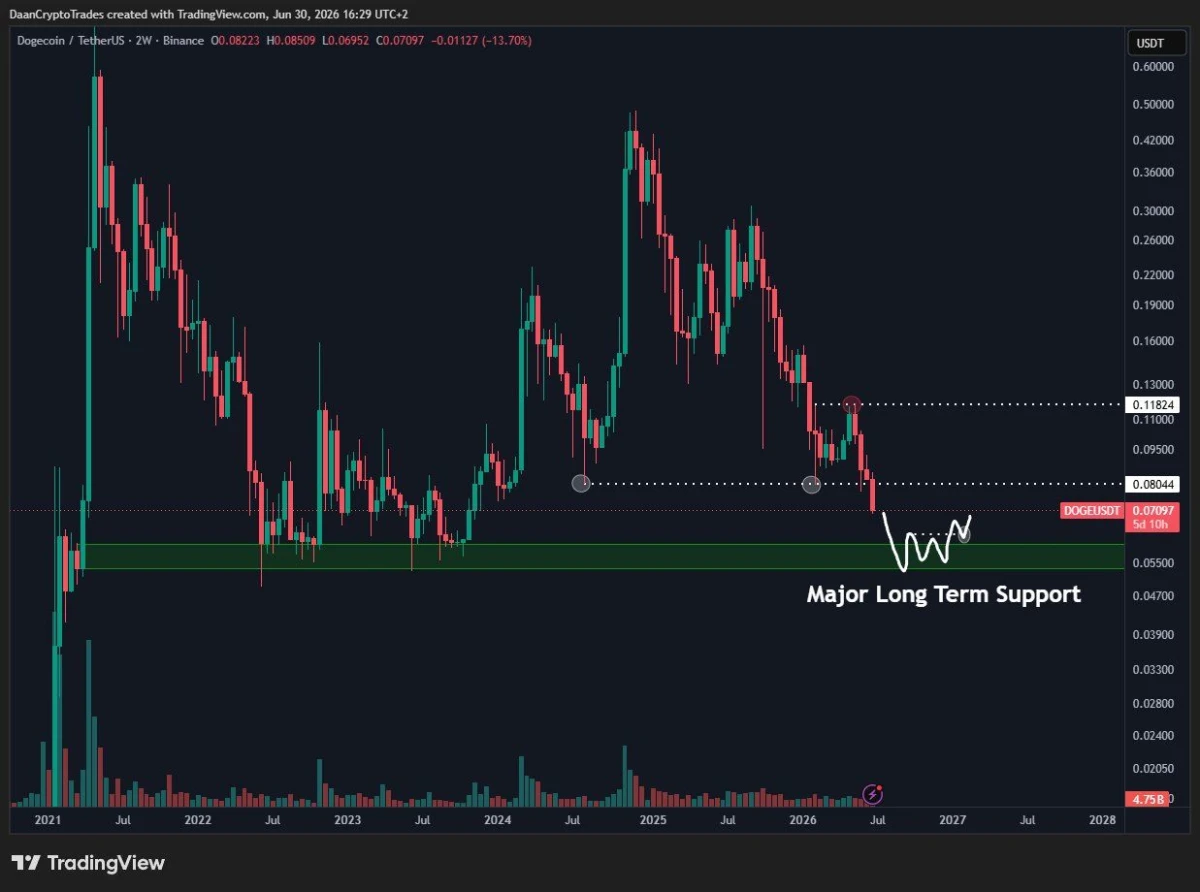
$DOGE/USDT two-week chart. Source: Daan Crypto Trades on X, TradingView
That area matters because $DOGE has reacted from this range several times since 2021. It also sits near the lower part of the broader market structure, where buyers have previously stepped in after deeper corrections.
Daan Crypto Trades said he would watch $DOGE closely if it returns to the $0.05 range. However, he also noted that a stronger setup would need more than one quick bounce. Sideways action over several months, followed by a break in market structure, would make the chart more interesting for a possible swing trade.
For now, $DOGE has not confirmed a bottom. The chart still shows weak momentum after the latest breakdown. A move into the long-term support zone could attract buyers, but the market would need to show stabilization first.
The first level to reclaim is $0.080. If $DOGE moves back above that area, the next resistance sits near $0.118. A break above both levels would give bulls a stronger recovery signal.
Until then, the setup remains cautious. $DOGE is nearing a major support area, but traders may wait for sideways action and a clear reversal before calling for a stronger bounce.