The $XRP Perpetual-Spot Volume Imbalance has dropped toward a reading near neutral, and this could impact how the $XRP price moves in the near term.
$XRP has collapsed 43% since the beginning of the year, as the downtrend that began in Q4 2025 lingers. Prices recently fell to $1.02, bringing the token back to the important psychological support level at $1.
The ongoing downtrend has led to several sharp sell-offs throughout 2026. However, the latest market data suggests that extreme price swings may not occur in the near term. Specifically, Binance’s Perpetual-Spot Volume Imbalance indicator shows that market activity has moved toward a more neutral state.
$XRP Volume Imbalance Data Indicates More Balanced Conditions
The data confirms that perpetual futures continue to account for a large share of market activity. However, current readings show that speculative trading has cooled compared to earlier months.
For the uninitiated, Binance’s Volume Imbalance indicator measures the difference between trading volumes in the perpetual futures market and the spot market. According to the latest figures, the Volume Imbalance currently stands at about 0.51, while the 30-day Z-Score is around 0.17.
These figures show that although perpetual trading remains stronger than spot trading, the gap between the two markets is still within the normal range seen over the past month.
The indicator has fluctuated between positive and negative levels in recent months as investor interest in derivatives changed. During $XRP’s price rallies in April and May, perpetual trading volumes rose massively, widening the difference between futures and spot market activity on several occasions.
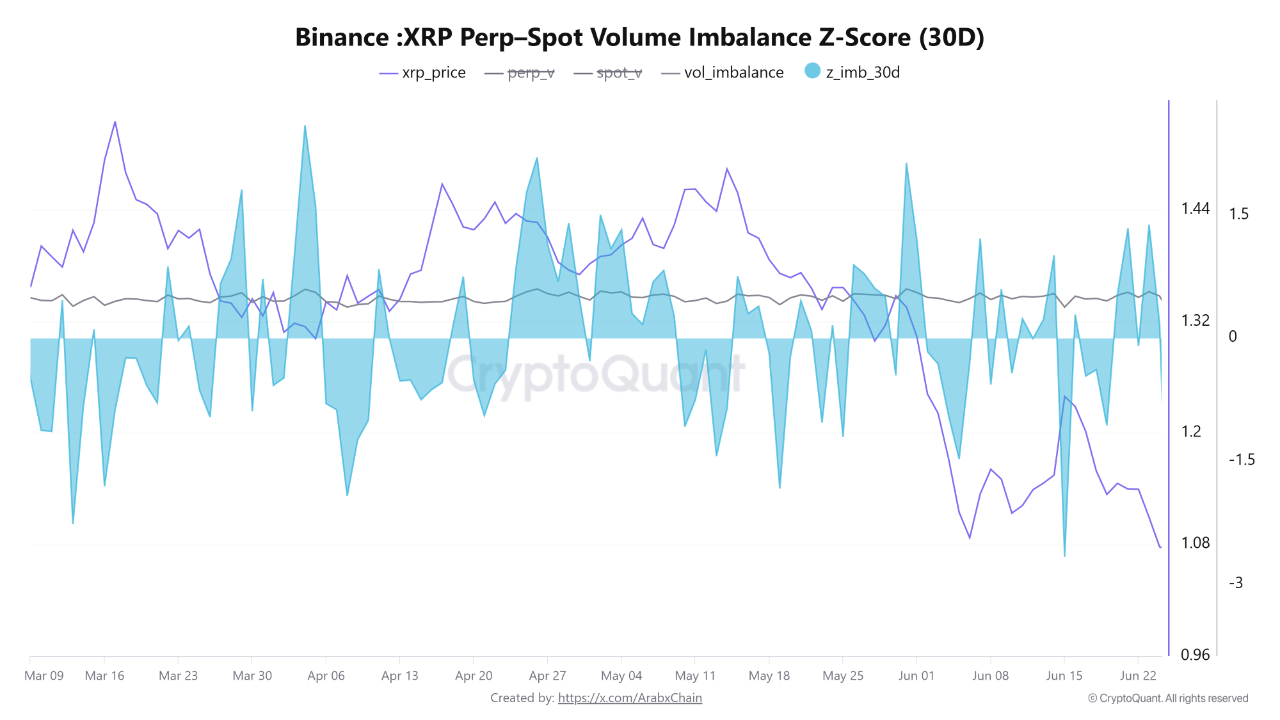
Meanwhile, as $XRP later entered a downtrend and speculative activity slowed, the imbalance gradually narrowed. This brought the 30-day Z-Score back closer to zero and shows a more balanced market environment.
Neutral Z-Score Could Reduce Volatility Risks for $XRP
Also, the 30-day Z-Score having a reading close to zero means that the present level of perpetual market dominance is still in line with the average activity recorded during the past 30 days. In other words, $XRP’s derivatives trading remains active, but it is not unusually high.
This suggests that the market is not experiencing excessive speculation. For context, such excessive speculation tends to increase the risk of sudden price swings and large liquidation events. Since leveraged positions do not appear overly crowded, the chances of sharp moves caused by forced liquidations may remain lower for now.
However, the data does not indicate that trader interest is falling. Notably, market participants continue to stay active, indicating that investors remain engaged with $XRP despite its prolonged decline.
$XRP Could Drop to $0.8 Before a Recovery
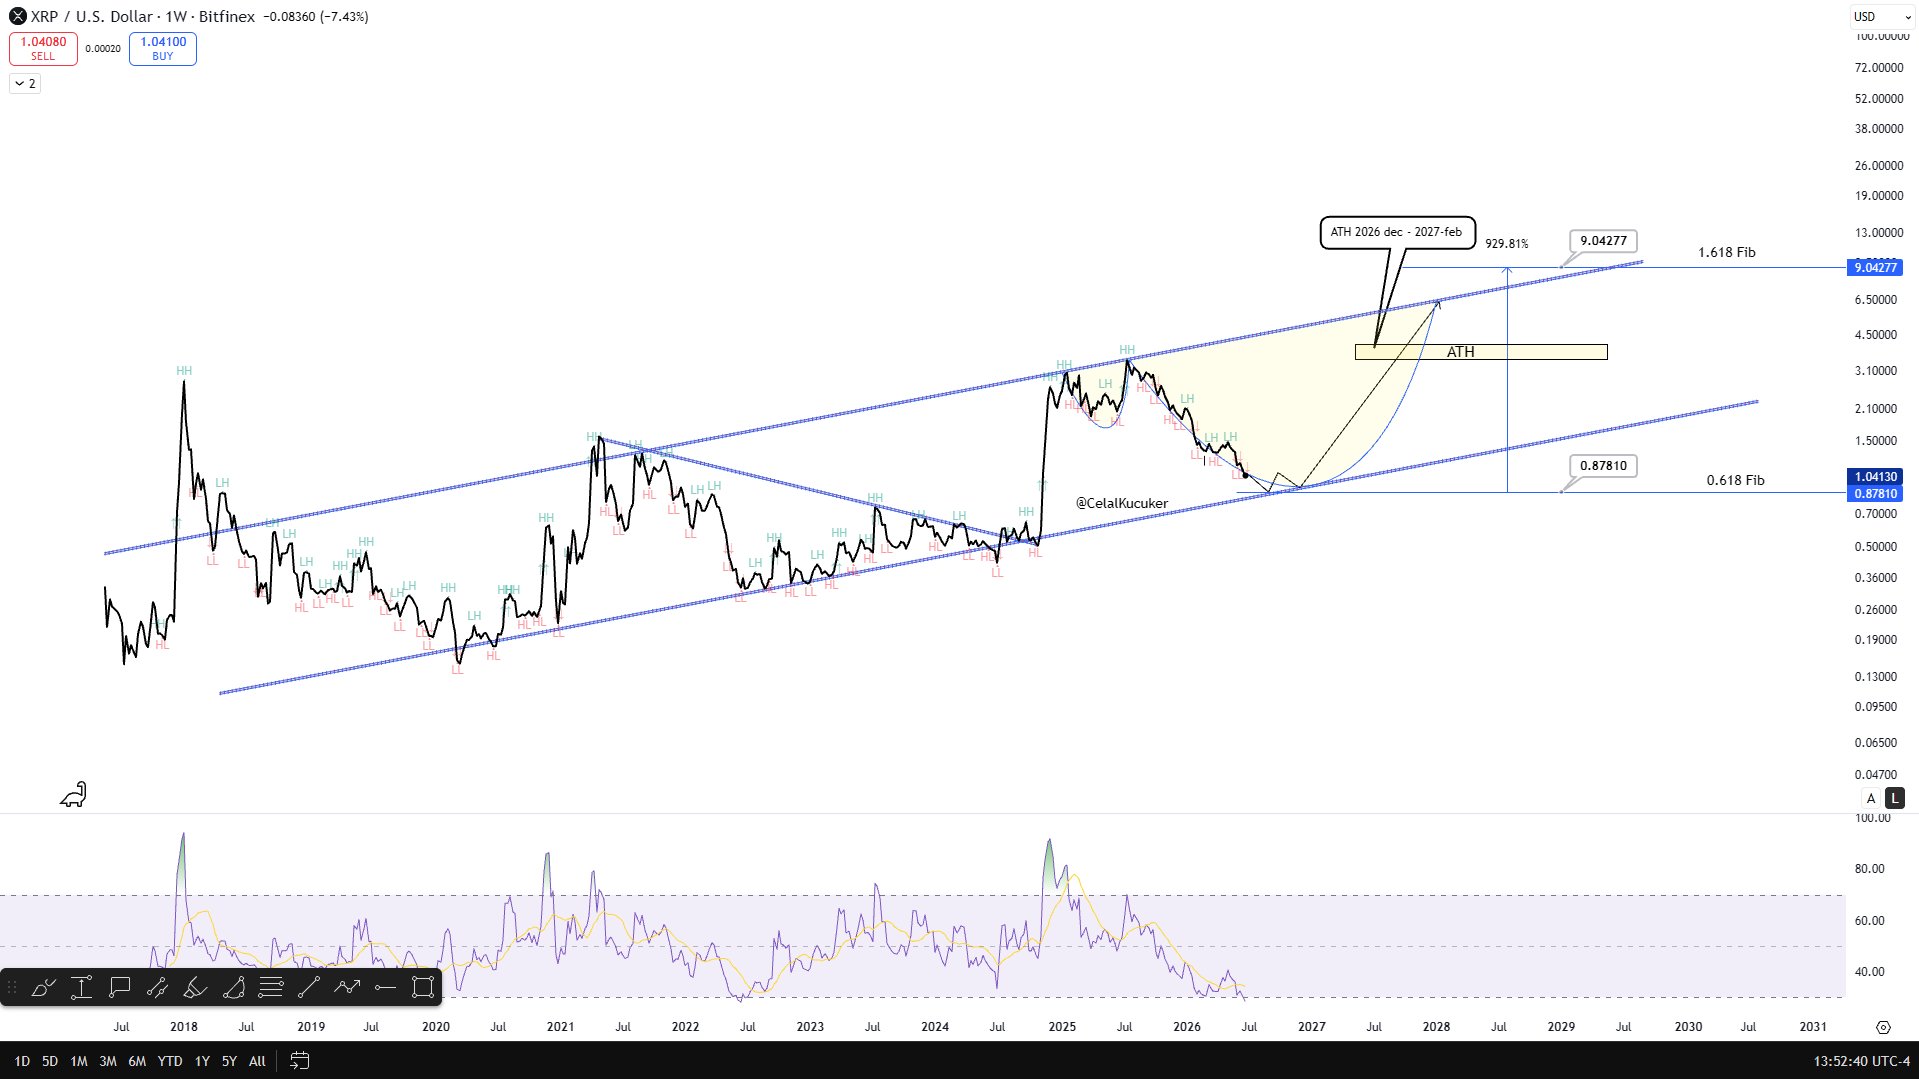
Meanwhile, some market analysts believe $XRP could still move lower before finding a bottom. For instance, Celal Küçüker recently revisited a chart scenario that he sees as one of the most likely outcomes. Notably, he expects $XRP to bottom between $0.86 and $0.87.
According to him, this projection aligns with a broader Bitcoin scenario that could see BTC decline to around $54,000. Küçüker also believes $XRP could eventually rise to between $8 and $9, representing gains of roughly 10x from current levels.
Another analyst, Chart Nerd, mentioned historical price behavior involving $XRP’s two-week 200 Exponential Moving Average (EMA). He noted that during the 2022 bear market, $XRP fell 23% below its 2-week 200 EMA before finally reaching a market bottom.
In 2026, $XRP’s 2-week 200 EMA currently sits near $1.02, close to the asset’s present trading price. Based on the previous cycle, Chart Nerd suggested that $XRP could still experience one final decline in the coming weeks, potentially falling to around $0.80 before completing its bottoming process.