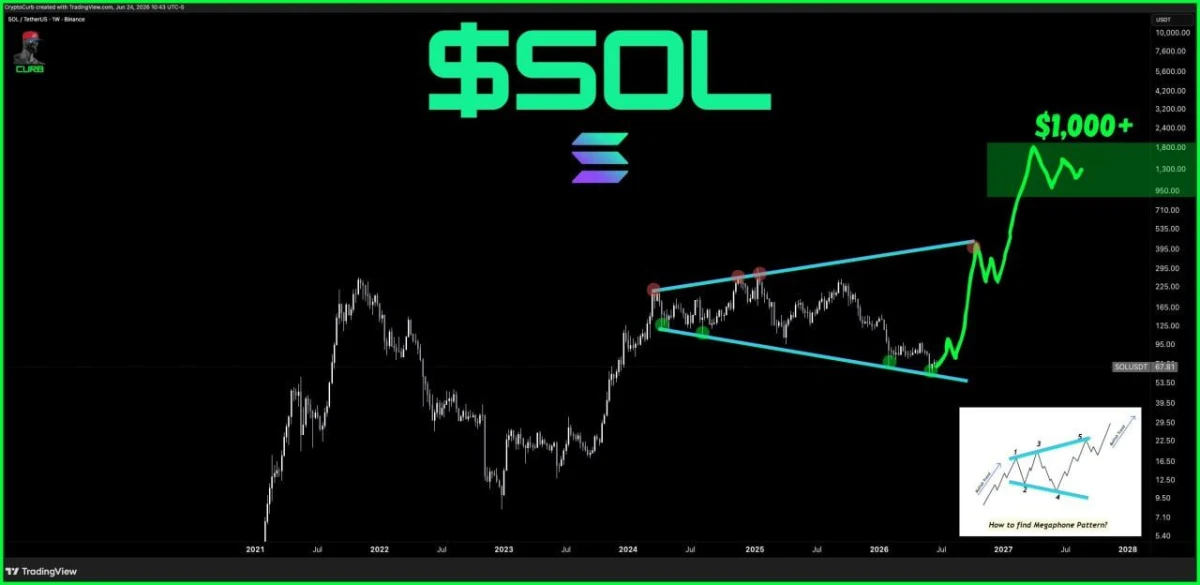
$SOL/USDT Weekly Megaphone Pattern Chart. Source: CryptoCurb (@CryptoCurb) on X
CryptoCurb projects that a successful recovery could take Solana toward $100, followed by the $200–$300 area. However, the larger bullish setup would require $SOL to break above the pattern’s upper trendline, which could sit near $400 as the structure develops.
A confirmed breakout from the megaphone could open the way toward the chart’s long-term target above $1,000. That remains a highly speculative projection rather than a confirmed price objective.
If $SOL loses the lower trendline and remains below roughly $55, the bullish pattern would weaken considerably. For now, the $55–$70 zone is the key support area, while $100 represents the first major level buyers need to reclaim.
Solana Retests Multi-Cycle Support as Bulls Eye $240
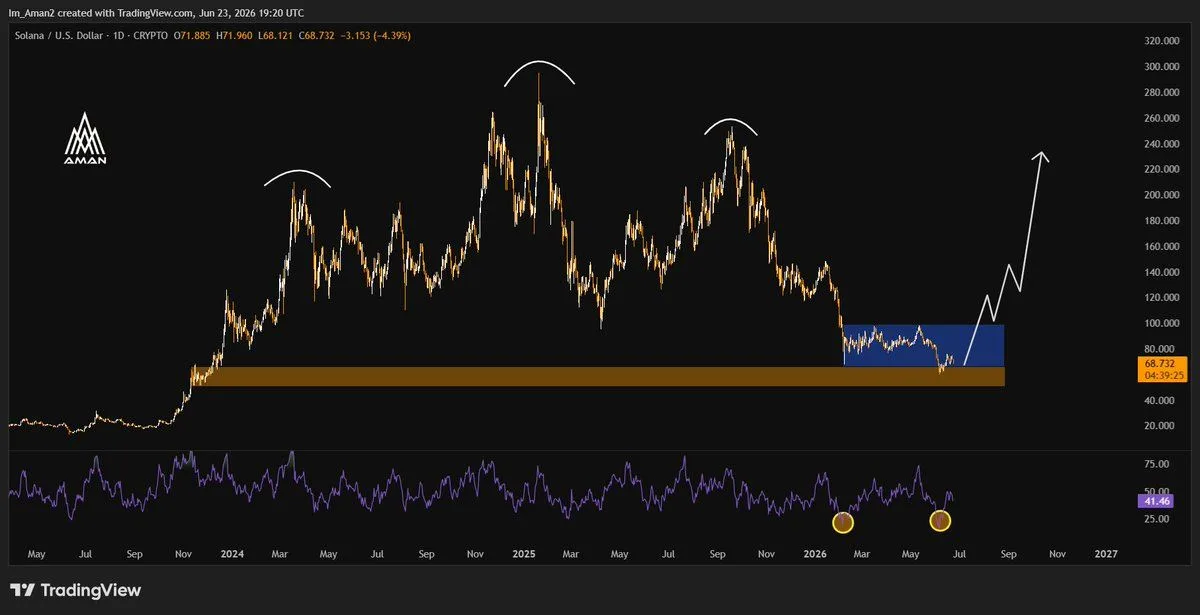
Solana is testing a major support zone near $60–$70 after months of sideways compression, raising the possibility that a longer-term base is forming.
The daily chart shows $SOL trading near $68.70, close to a support region that also acted as a major breakout area during the previous market cycle. Price has briefly moved below the recent consolidation range, but it remains above the lower edge of the wider support zone.
$SOL/USD Daily Multi-Cycle Support Chart. Source: Aman (@Im_Aman2) on X
The chart also highlights two recent RSI lows. Although the current RSI has recovered to around 41, the earlier oversold readings suggest selling pressure may be losing strength. However, that alone does not confirm a reversal.
For the bullish setup to improve, Solana must recover into the recent range and reclaim the $90–$100 area. A successful breakout could open the way toward $120–$150, followed by the chart’s broader projection near $220–$240.
However, a sustained break below the $50–$60 support zone would weaken the base-building scenario and increase the risk of further losses.
For now, Solana remains at a critical support area, but buyers still need to reclaim $100 before a larger recovery becomes more convincing.

 coinpaper.com