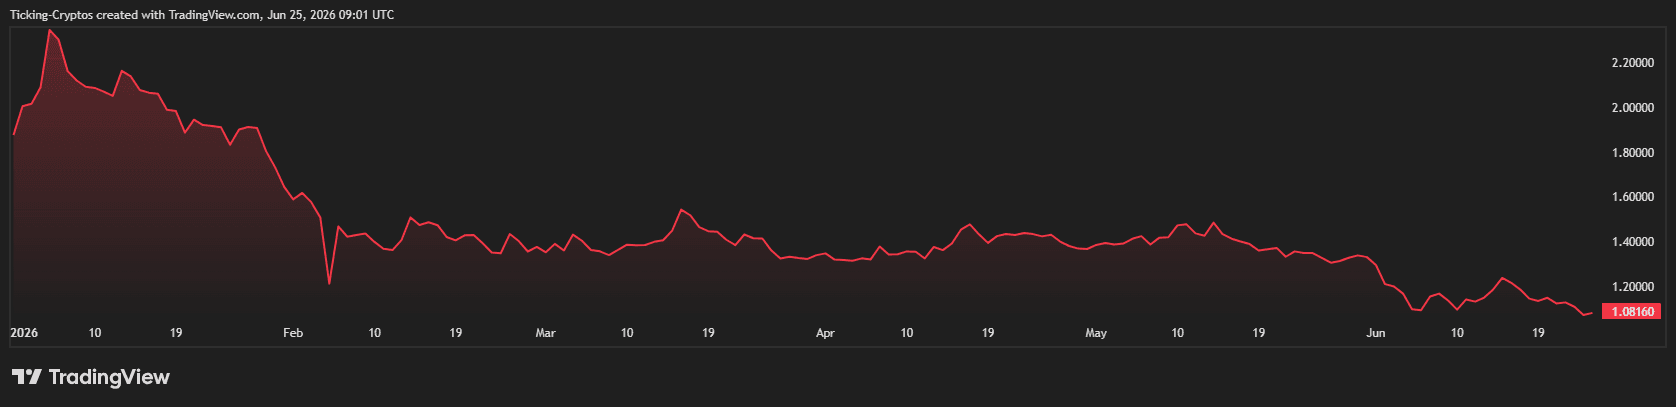
$XRP is getting hammered. As Bitcoin smashed below the $60,000 floor, Ripple's token cratered right alongside it, sliding all the way down to around $1.08 after briefly dipping below $1.05. The $1 psychological level — once a distant safety net — is now staring traders dead in the face.
How did $XRP crash to $1?
This wasn't an $XRP-specific collapse — it was guilt by association. $XRP has a long, well-documented history of amplifying Bitcoin's moves to the downside. On every major Bitcoin drop this year, $XRP has lost close to twice as much as Bitcoin, with the ratio staying consistent at around 1.8 to 1.
So when Bitcoin broke below $60,000, $XRP didn't stand a chance of holding firm. The setup here is arguably uglier than the last big flush. Bitcoin breaking below $60,000 for the first time since October 2024 — after Strategy broke its years-long never-sell rule and spot Bitcoin ETFs ended their longest outflow streak ever — created conditions worse than the February Iran-war crash, when buyers had stepped in at the $1.11 level that has now broken.
And the key support that bulls had been defending all year finally gave way. $XRP was holding $1.28 — the level buyers had defended on every dip since February — barely a week ago, before sliding steeply with $1.11 broken and the $1 floor closing in.
$XRP Price Analysis: Is $XRP RISKY to Buy?
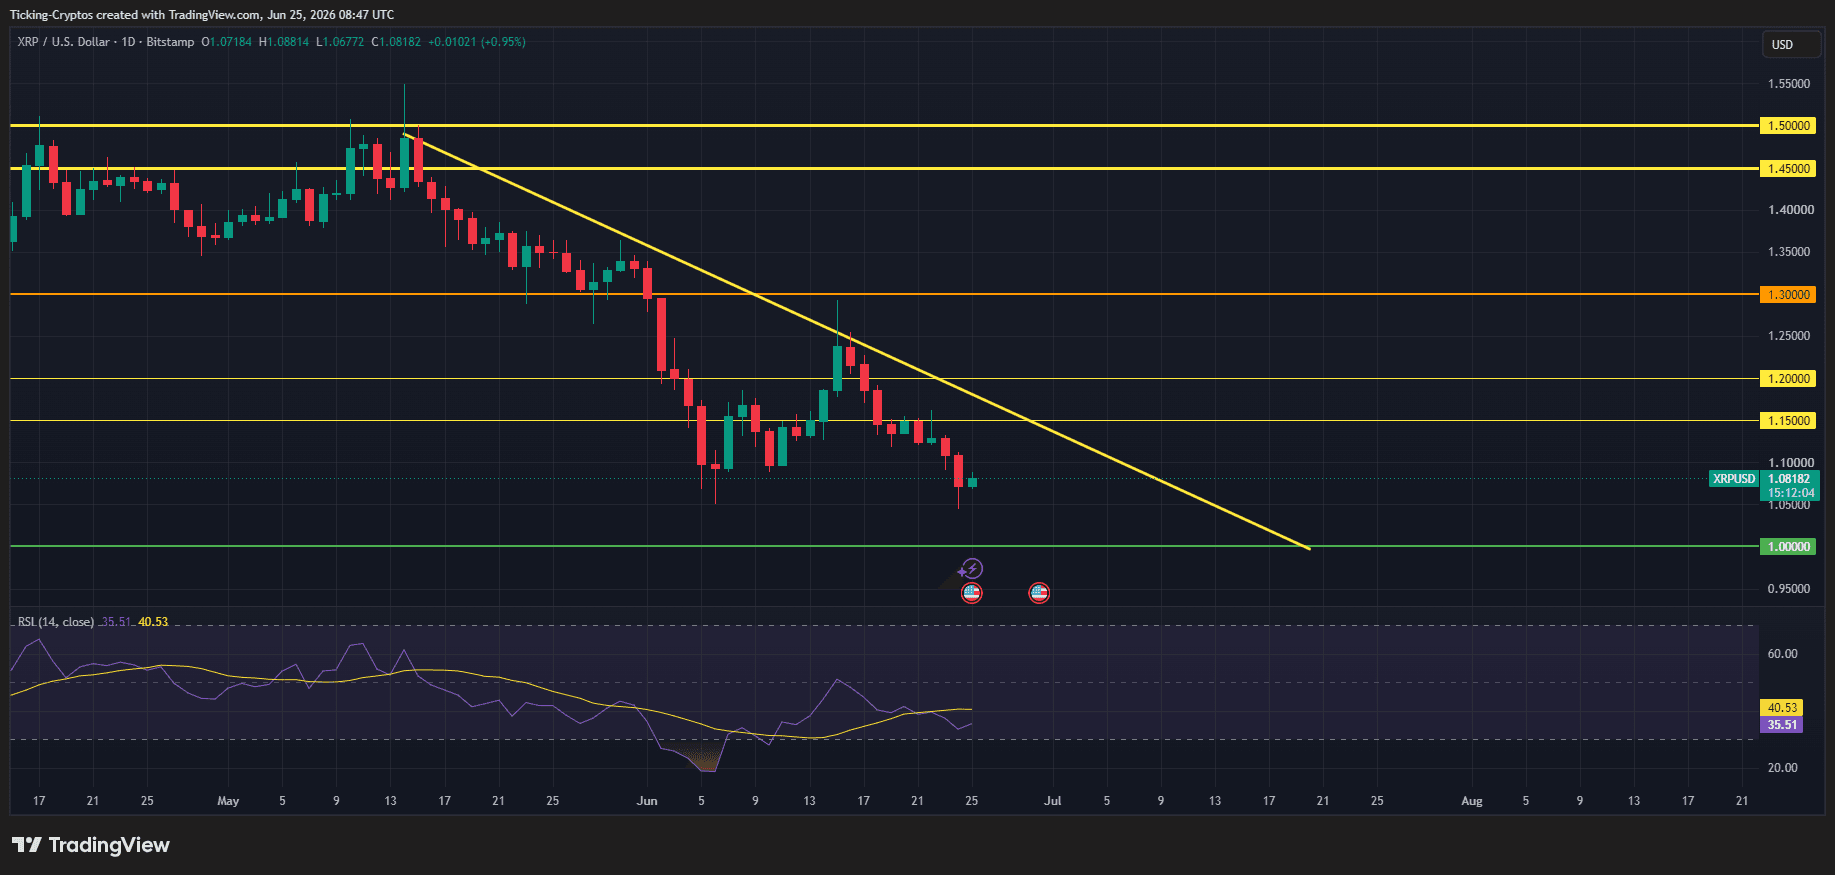
The daily chart paints a textbook bearish picture. Since topping out near the $1.50 resistance zone in mid-May, $XRP has been locked inside a clean descending trendline — a steady sequence of lower highs and lower lows that has capped every bounce attempt.
The key technical takeaways:
- The downtrend is intact. Every rally since mid-May has been sold into at the descending yellow trendline. The mid-June bounce toward $1.30 failed exactly there before rolling over again.
- Broken support turned resistance. The $1.15 and $1.20 levels that once acted as support have flipped into overhead resistance. $XRP now trades below both.
- The $1.00 line is the last stand. The green support line sits right at the psychological $1.00 mark. That's the level the entire chart is now gravitating toward.
- RSI at 40.53. Momentum is bearish but not yet deeply oversold on the daily. The RSI sitting around 40 means there's still room to fall before sellers are fully exhausted — a warning sign for anyone expecting an immediate bounce.
The structure is clear: until $XRP can reclaim the descending trendline and flip $1.15 back to support, the path of least resistance points lower.
$XRP price prediction: where does Ripple go next?
Here's where it gets interesting. The near-term picture hinges almost entirely on two things — Bitcoin and the CLARITY Act.
- The bearish case (downside to $1 and below). With $1.05 broken, the chart is thin. Analysts identify $1.13 as $XRP's critical weekly support, noting that a confirmed break below it could bring the $0.90–$1 target zone into focus, citing Bitcoin's weakness as the key drag. Worse-case macro scenarios get uglier still — should Bitcoin drop beneath $60,000 while ETF decisions stall and regulatory progress halts, some projections suggest $XRP could settle between $0.21 and $0.75. That's a tail risk, not a base case, but it shows how much damage a prolonged $BTC breakdown could do.
- The bullish case (a violent snap-back). Here's the twist that makes $XRP fascinating right now. While the price bleeds, on-chain data tells the opposite story. $XRP whales now control 45.83 billion tokens — 68.5% of circulating supply, the highest concentration since May 2018 — and Binance whale outflow dominance recently hit 91.4%, the same reading that preceded $XRP's rally from $0.50 to over $3 in late 2024. On top of that, positioning is extremely lopsided: short bets currently outweigh longs by roughly 9 to 1, meaning any surprise positive catalyst — like a Senate floor vote going through — could trigger a short squeeze that moves $XRP far faster than fundamentals alone would suggest.
- The CLARITY Act is the wildcard. This is the single biggest swing factor. If the bill clears and the macro stabilizes, Standard Chartered forecasts $XRP could hit $2.80, with the bullish analyst range extending toward $8 — but if the CLARITY Act stalls and slips to 2030 or beyond, prices could drop closer to $0.53. That's roughly 30–40% downside against 2.5x–7x upside, which is exactly why $XRP holders are glued to this vote.
The levels that matter
For your $XRP price prediction watchlist, keep these on the radar:
- Immediate support: $1.05, then the all-important $1.00 psychological floor.
- If $1 breaks: the $0.90 zone comes into play, with little technical support beneath.
- Upside reclaim: $XRP needs to break back above the descending trendline and flip $1.15 into support to even begin repairing the structure. Above that, $1.20 and $1.30 are the next hurdles.
$XRP Price Prediction: Will $XRP Crash Below 1$?
$XRP's crash to $1 isn't a Ripple problem — it's a Bitcoin problem, amplified by $XRP's tendency to fall nearly twice as hard on every $BTC drop. The daily chart is firmly bearish, the descending trendline is still in control, and the $1.00 line is the last meaningful support before things get really thin.
But the setup is a coiled spring. With whales accumulating, shorts dangerously crowded, and the CLARITY Act floor vote looming as a binary catalyst, $XRP could see an explosive move in either direction. For now, respect the downtrend — but don't be surprised if a single headline flips this chart violently.