
- Humanity Protocol lost 35%, trading at $0.076.
- There is a risk of further downside.
The crypto market has brought in a fear sentiment across the tokens. All of them are swinging in red, with Humanity Protocol (H) registering a 35.93% loss in value over the last 24 hours.
At press time, the asset is trading at $0.07611, and the price could retrace to a support at around $0.075. With a more potent bearish pressure, it might head down toward the crucial $0.073 range.
On the other hand, if Humanity Protocol price action gains the lost traction back, there would be a move to the $0.077 zone. A stable climb on the upside likely pushes the price up above $0.079.
In the early hours, Humanity Protocol was trading at a high range of $0.1278, and when the bears took control, the price dropped considerably to a bottom level of $0.07507. It is worth noting that the daily trading volume has surged by over 19.87%, reaching the $44.59 million mark.
Where is the Humanity Protocol Headed From Here?
Zooming in on the 4-hour trading chart, the Moving Average Convergence Divergence (MACD) line of Humanity Protocol is below the signal line. Also, both of them are lying below the zero line, which indicates bearish momentum within an existing downtrend.
It shows that the selling pressure is increasing, and as the bears remain in control, the risk of further downside stays elevated unless momentum begins to improve.
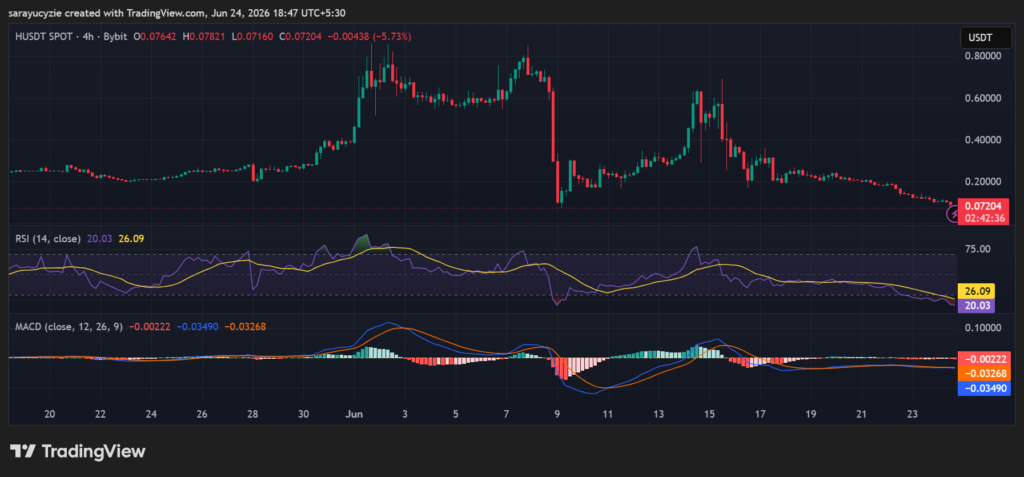
Besides, the daily Relative Strength Index (RSI) is found at 20.03, suggesting that Humanity Protocol is deeply oversold. Technically, the selling pressure has been very strong, pushing momentum to an extreme level. The bears remain firmly in control of the current trend.
However, such a low value can also signal that the decline is becoming overstretched, increasing the likelihood of a short-term relief bounce if buyers begin to step in.
Furthermore, these two indicators together help gauge momentum and trend strength in price action. MACD shows whether momentum is strengthening or weakening. RSI measures the intensity of buying and selling. When both indicators turn bearish, the price momentum faces continued downward pressure. When both turn bullish, the chances of a sustained upward move generally improve.