
A Bull Market Holding Its Breath
Micron stock enters earnings week with structural strength but fraying short-term momentum. Price sits above all key EMAs, yet the June 23 session reversed sharply from $1,125 to close at $1,051.77. The market is pricing uncertainty ahead of Q3 results — not simply consolidating.
Key Takeaways
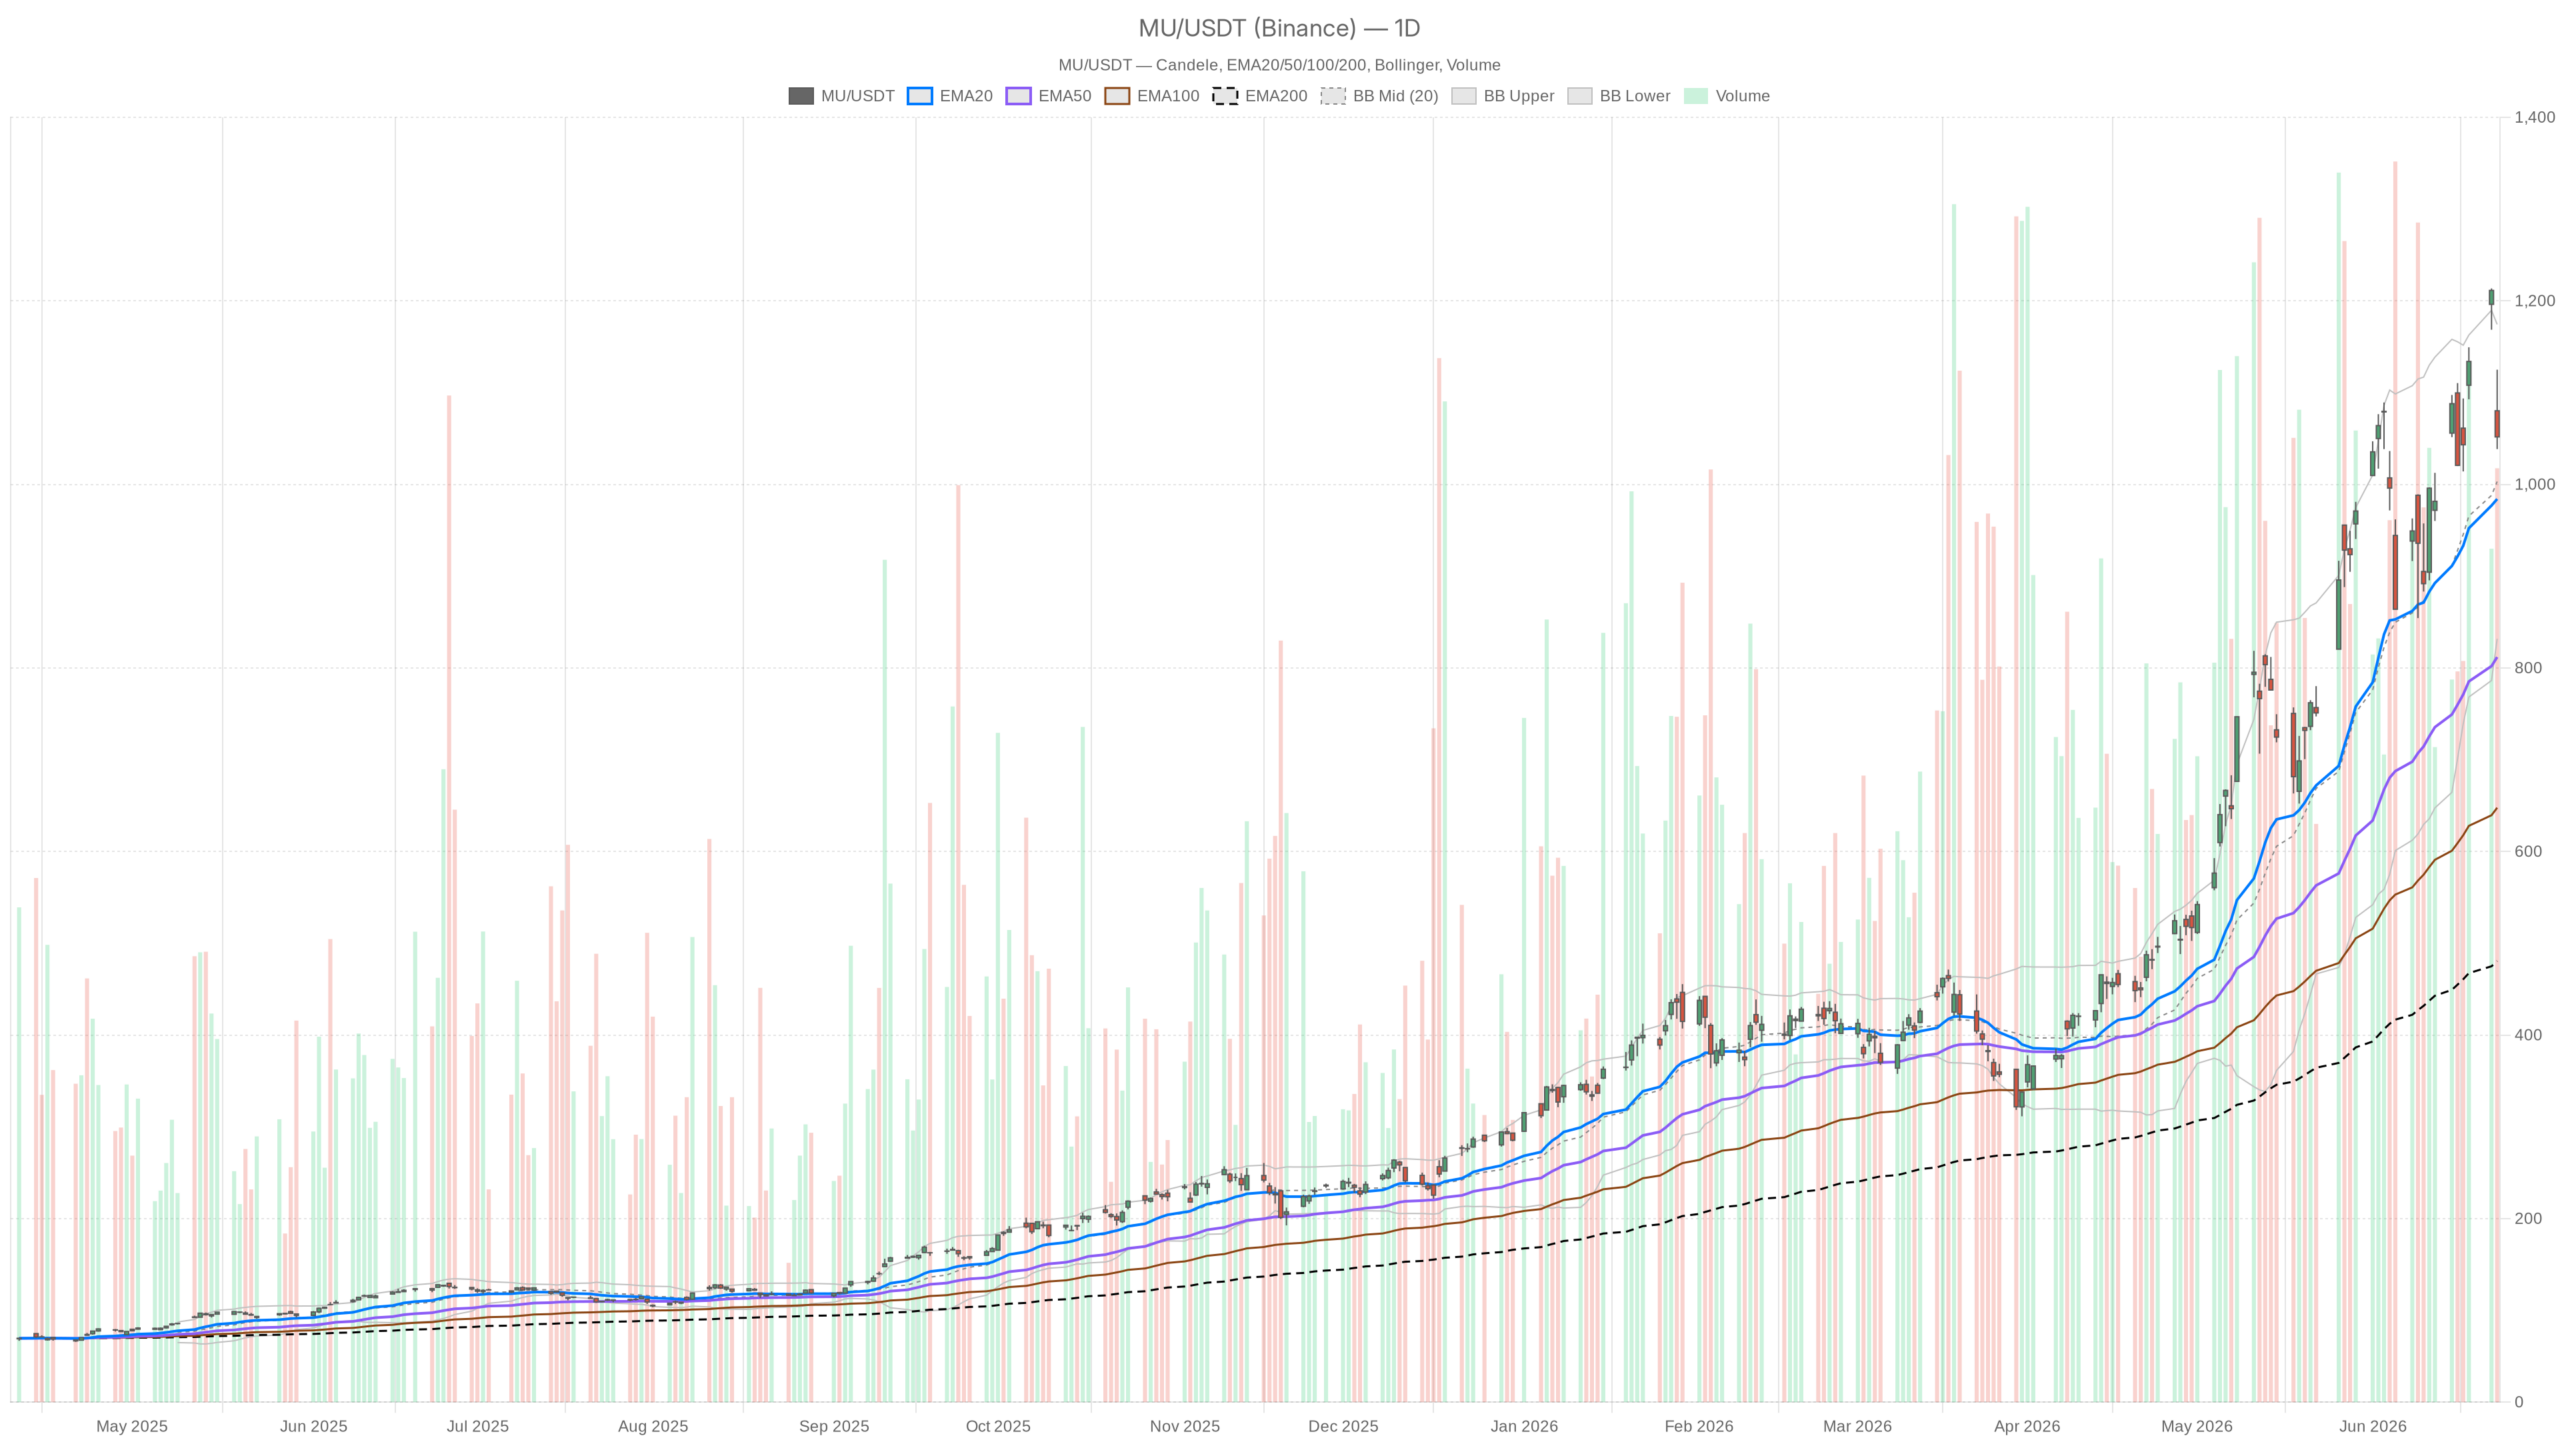
- Micron stock holds a structurally bullish daily trend with price above the 20-day, 50-day, and 200-day EMAs.
- The hourly chart shows an active intraday pullback, with the MACD histogram deeply negative at -18.46 and RSI near oversold at 39.4.
- Options markets are pricing a roughly 13% post-earnings swing, implying a projected range of $920 to $1,200.
- The $1,071 daily pivot serves as the key upside reclaim level, while $1,018 (S1) is the critical support to hold.
- The daily MACD histogram sits barely positive at 1.45, signaling fading bullish conviction ahead of the binary event.
Daily Timeframe: Micron Stock Trend Intact, But Stretched
The daily chart confirms Micron stock’s uptrend is structurally intact, though bullish momentum is softening ahead of earnings.
On the daily chart, the EMA stack is well-ordered. Price trades above the 20-day EMA at $984, which sits above the 50-day at $811 and the 200-day at $480. That kind of stacking across all three levels signals a sustained uptrend, not a bounce. Bulls have controlled the tape for an extended period.
Momentum Indicators Flash Caution
At the same time, the daily RSI at 57 reflects healthy momentum without being overbought. There is theoretical room for further upside before the chart becomes technically exhausted. The MACD histogram of just 1.45 — barely positive — suggests the bullish impulse has softened noticeably. The line and signal are near convergence, indicating fading conviction rather than an outright reversal.
Bollinger Bands on the daily frame place the upper band at $1,174 and the lower at $831. The midline sits near $1,003. The June 23 close of $1,051 sits modestly above that midline, in the upper half of the band. This is consistent with a bullish bias, but not pressing against resistance.
Pivot analysis, however, adds a note of caution. The daily pivot sits at $1,071, with R1 at $1,105 and S1 at $1,018. The stock closed below the pivot — a mild negative for near-term price action. A recovery above $1,071 would reassert short-term control for bulls.
Hourly Timeframe: Micron Stock Pullback in Progress
The hourly chart reveals an active intraday downtrend in Micron stock. Price trades below key EMAs and selling pressure is not yet exhausted.
Currently, the hourly RSI has dropped to 39.4, approaching oversold territory without yet triggering it. More importantly, the MACD histogram on the 1-hour is deeply negative at -18.46 — a meaningful short-term bearish signal. Selling pressure over the past several sessions has been consistent and not yet exhausted at this timeframe.
Bollinger Bands and Key Support Levels
In contrast to the daily Bollinger picture, the 1-hour midline sits at $1,133 — well above current price. This gap reflects just how far MU has pulled back in the near term. The lower hourly Bollinger band at $1,027 becomes a key reference. A close below that level would signal the intraday correction deepening materially.
Therefore, the daily and hourly frames are in conflict. The daily chart says the uptrend is structurally intact. The hourly chart says the market is in active distribution ahead of earnings. Both can be true simultaneously — and that is precisely the challenge for traders right now.
15-Minute Frame: Stabilization Attempt, No Confirmation Yet
On the 15-minute chart, Micron stock shows tentative stabilization, but no confirmed reversal signal has emerged.
The RSI at 33.2 puts it in near-oversold territory. The MACD histogram has turned marginally positive at 1.42, offering a tentative signal that selling momentum may be slowing. Still, price remains below all three EMAs on this timeframe, including the 200-period at $1,068. That structural weakness limits the significance of any short-term bounce attempt.
The 15-minute ATR of $10.73 reflects tight intraday ranges, typical of a market waiting for a binary event. Pivots on this frame cluster tightly between $1,044 and $1,058, placing current price squarely inside the pivot zone. Execution context here favors patience over action.
Bullish Scenario: Micron Stock Rally Resumes on Earnings Beat
The bullish case for Micron stock rests on two pillars: the intact daily structure and the earnings catalyst. Data center demand for AI memory has been cited as sky-high heading into Q3 results.
If Micron delivers revenue and guidance that validates that demand, the stock has technical room to reclaim the $1,105–$1,125 zone quickly. A close back above the daily pivot at $1,071 would be the first signal of recovered confidence.
Beyond the immediate earnings event, the FY2027 upside narrative gives bulls a longer-term thesis to anchor to. This narrative is driven by storage class memory, NAND pricing, and AI infrastructure buildout. The daily EMA stack remains a powerful reminder that this is still a stock in a structural uptrend. A post-earnings re-rating to the upper Bollinger band near $1,174 is plausible if results exceed elevated expectations.
Bearish Scenario: Elevated Expectations Become a Liability
However, the bearish risk for Micron stock is equally tangible. The options market pricing a $920–$1,200 range underscores that the downside case is taken seriously.
If earnings disappoint — or if guidance signals that the AI memory cycle is peaking — the stock faces a technically vulnerable setup. Price is already below the daily pivot and the hourly trend is firmly bearish. A break below the hourly Bollinger lower band at $1,027 would be the first warning. A move through the daily S1 at $1,018 would confirm a more serious correction.
Notably, the pre-earnings sell-off already in motion suggests the market has partially de-risked. However, partial de-risking is not protection. The AI trade has demonstrated it can unwind sharply, as Tuesday’s broader tech sell-off showed with Nvidia and AMD moving in tandem. Micron is not isolated from that sentiment shift. If the Q3 print fails to justify elevated multiples, the daily MACD — already barely positive — could tip negative quickly.
Positioning Into a Binary Event
Overall, Micron stock enters earnings in a structurally bullish posture on the daily chart. However, meaningful short-term deterioration across the hourly frame reflects genuine market indecision ahead of a high-stakes print.
Meanwhile, the options market has already priced in substantial risk. Straddles imply a roughly 13% post-earnings swing and a projected range of $920 to $1,200. This is a high-stakes event with the AI memory cycle at the center of the debate.
This is not a moment for directional conviction without a clear edge. The daily trend deserves respect, but the hourly momentum argues against assuming the pullback is already done. Traders watching the $1,071 pivot on the upside and the $1,018 support on the downside will have the clearest read. Which narrative takes control will be determined after earnings hit the tape.
FAQ
What is the projected post-earnings price range for Micron stock?
Options markets are pricing a roughly 13% post-earnings swing for Micron stock, implying a projected range of approximately $920 to $1,200 based on current straddle pricing.
What key support levels should traders watch for MU?
The critical support levels are the hourly Bollinger lower band at $1,027 and the daily S1 pivot at $1,018. A break below $1,018 would confirm a more serious correction is underway.
Is Micron stock’s daily trend still bullish ahead of earnings?
Yes, the daily trend remains structurally bullish. Price trades above all three key EMAs (20-day, 50-day, and 200-day), and the broader trend regime is flagged as bullish. However, short-term momentum has softened notably.
What does the hourly chart indicate about MU’s near-term momentum?
The hourly chart shows an active intraday downtrend, with price below the EMA20 and EMA50. The MACD histogram is deeply negative at -18.46, and the RSI has dropped to 39.4, confirming selling pressure is not yet exhausted on this timeframe.
Disclaimer: This article is for informational purposes only and does not constitute financial advice, an investment recommendation, or a solicitation to buy or sell any financial instrument or cryptocurrency. The analysis provided is not indicative of future results. Investing in crypto assets and financial markets carries a high risk of capital loss. Always do your own research (DYOR) and consult a qualified financial advisor before making any decision.
Article produced with the assistance of artificial intelligence and reviewed by the editorial team.