cryptopotato.com
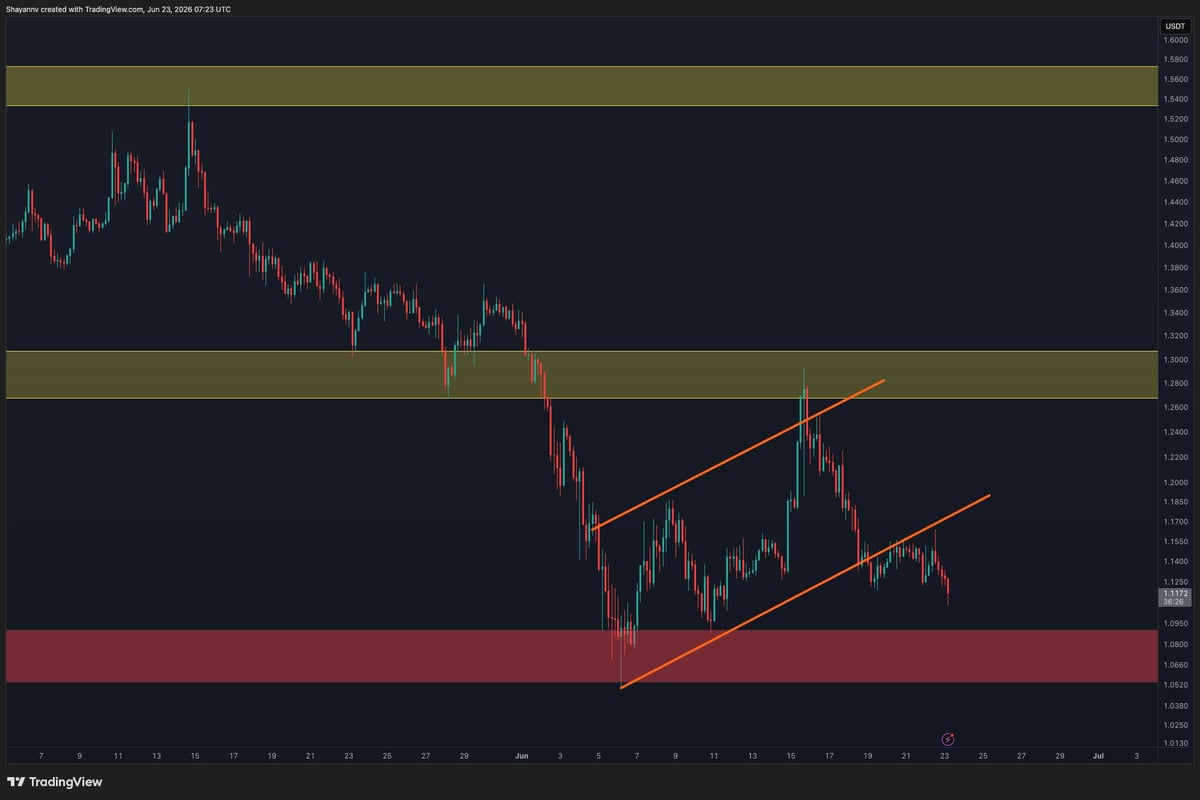
$XRP remains under pressure after failing to sustain last week’s recovery attempt. The latest price action shows sellers regaining control near a key resistance zone, pushing the asset back toward a major support area that is now becoming the focal point for the short-term trend.
Ripple Price Analysis: The Daily Chart
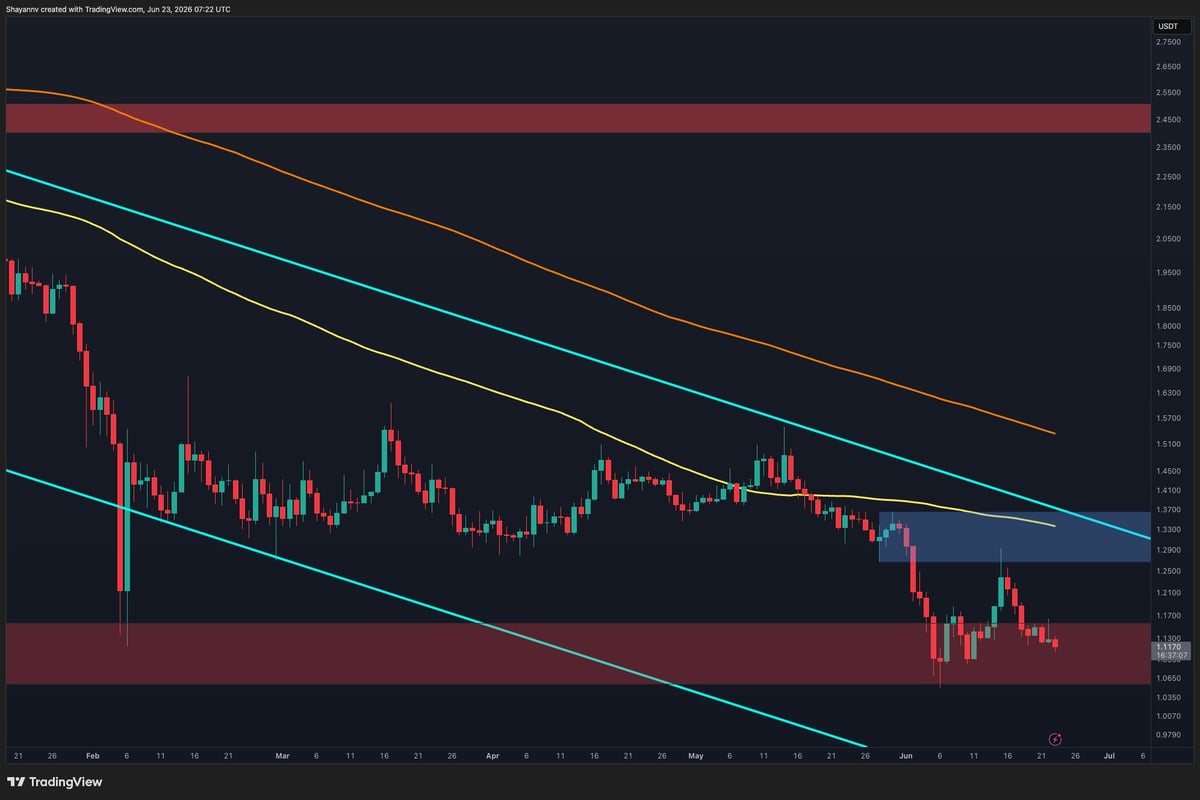
On the daily timeframe, $XRP continues to trade within a broad descending channel and remains below both the 100- and 200-day moving averages. The recent rebound stalled beneath the 100-day MA and the lower boundary of the highlighted resistance zone around $1.28 to $1.35, reinforcing the bearish higher-timeframe structure.
The most recent development is the rejection from that resistance area and the subsequent move back toward the $1.07 to $1.15 demand zone. This support region has repeatedly attracted buyers throughout June and remains the most important level on the chart.