The current $XRP downtrend may have lasted for a long time, but it still maintains a bullish long-term structure and could rebound considerably soon.
At the time of writing, $XRP trades at $1.13. Barely one year ago, the coin made a new all-time high of $3.66, breaking its over 7-year peak price. Now, the 69% correction from that peak to the current level comes amid a prolonged price downtrend that has plagued the entire crypto market.
The Broader $XRP Structure Still Bullish
If the month closes as it stands, $XRP would have dropped in 8 of the last 9 months, with the exception being the mild 2% increase recorded in April. This clearly reflects the current state of the market and how bears have dominated proceedings for a long time.
Nonetheless, higher timeframes paint a different picture. While the trend has been corrective for months, the 1-month chart shows that $XRP still maintains a bullish structure. The asset has consistently made higher highs and higher lows since inception.
Even the current bear market has not broken this trend. As such, this downward push could be another higher low pattern where price retests key resistance-turned-support zones before another uptrend to new highs.
This consistent broader bullish structure continues to strengthen the narrative that the current prolonged decline could be temporary and part of a broader bullish picture, as long as the asset holds key price levels.
Support Forming at This Key 2021 Level
Currently, $XRP trades at the support level near $1.10. This is a major demand zone that analysts are closely monitoring because of its significance.
Notably, that level aligns with a former resistance level during the 2021 bull run. Between August and November 2021, $XRP struggled to close above the $1.10 resistance. Prices closed at $1.18 in August 2021, $0.95 in September 2021, $1.11 in October 2021, and $0.99 in November 2021 after reaching much higher prices. Eventually, $XRP gave way to the bearish pressure, dropping much lower.
However, in November 2024, prices blew past this resistance with strong volume, turning it into a key support area. The coin is back at this area again, and market watchers are observing whether it holds or falls lower.
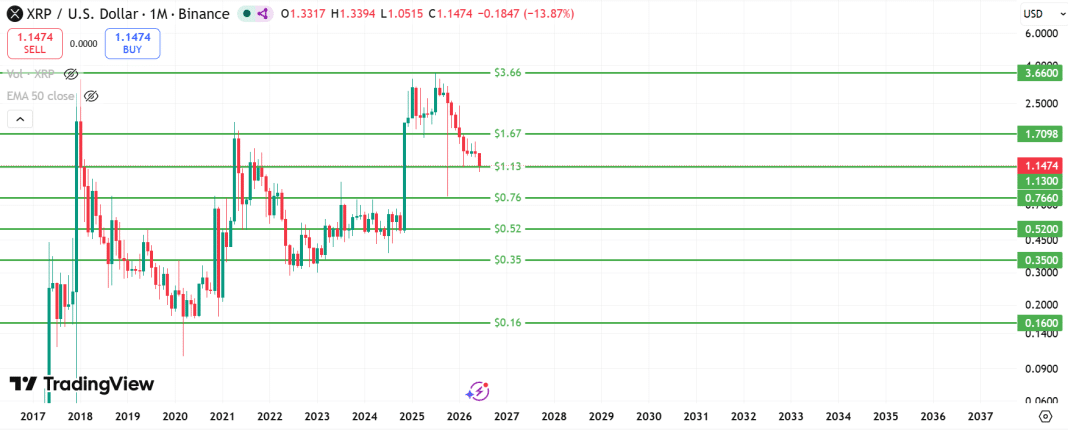
The coin is already finding support here, having rebounded from $1.05 earlier to its current price. Should $XRP find stability here and the broader market conditions start to improve, it could start to gain strength.
However, further downside could take $XRP to the support levels at $0.76, $0.52, $0.35, and $0.16, as identified in the shared chart. This represents declines of 33%, 54%, 69%, and 86%, respectively.
Good Time to Buy $XRP?
Notably, several analysts still expect $XRP to drop below $1. Analyst CasiTrades believes the coin could drop to $0.87 before any notable recovery, calling that area the ideal “buy zone.” This also aligns closely with the projection from top chartist Ali Martinez.
Nonetheless, analysts believe that always expecting further decline hinders accumulation. With $XRP already significantly below prior highs and at multi-year support regions, it has already provided a good entry point.
Moreover, the current support could hold and invalidate lower calls. In this case, those who buy at the current levels are well positioned for the rebound that could follow. Analysts suggest that reclaiming $1.50 is a sign of a major bullish breakout. A sustained recovery could see $XRP retest its ATH at $3.66, representing a 224% increase from the current market price.
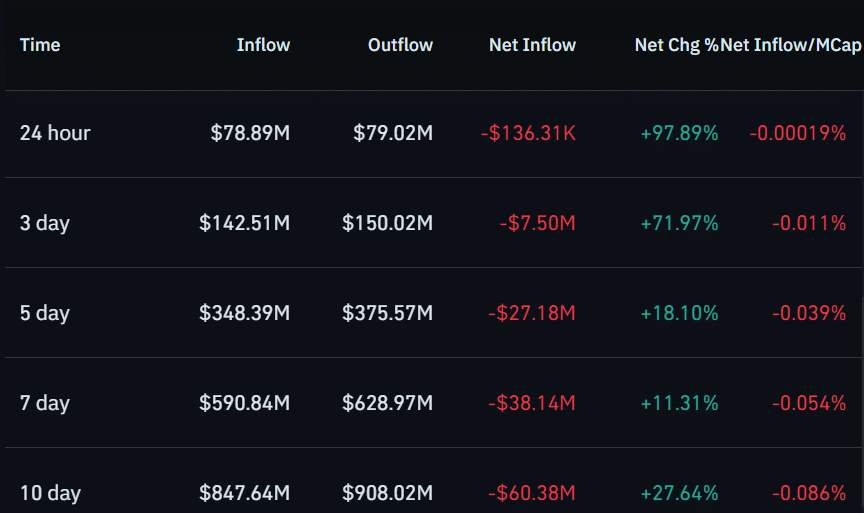
Interestingly, market users seem to already be accumulating. Over the past seven days, spot exchange outflows have surpassed inflows, showing that users are withdrawing $XRP from exchanges to platforms where they can hold long-term. During this period, inflows stand at $590 million and outflows at $629 million. This bullish trend persits across all timeframes.