Shiba Inu has formed a bearish structure that could drive prices lower, but bulls could invalidate this by reclaiming a key level.
Shiba Inu ($SHIB) remains almost unchanged in the past 24 hours, correcting less than 1% during this period. Still, the broader structure continues to lean bearish.
The third-largest meme coin by market cap dropped 2% on Sunday, closing the past week 7.7% lower than its opening price. This now means that $SHIB has dropped over 15% in June and is on course for its largest monthly decline since December 2025.
Meanwhile, a fresh chart analysis suggests the possibility of further price declines.
Shiba Inu Rejected at Resistance
An analysis of the $SHIB/USD 4-hour chart shows that Shiba Inu faced rejection at a descending resistance trendline, creating a bear trap. That rejection occurred after its price revisited a key supply zone at $0.00000520 last Monday, reinforcing the idea that sellers remain firmly in control.
Meanwhile, more than just one technical indicator supports this bearish case. Momentum indicators have also begun flashing warning signs, with a clear bearish divergence emerging on the relative strength index (RSI). While its price made higher highs, the RSI made lower highs and lower lows.
An order block breakdown adds more bearish perspective. The chart shows that the area around $0.00000520 aligns with an order block, a zone where smart money market users placed large sell orders in this case.
A rebound to the resistance also confirmed a fair value gap (FVG) formed in early June. Shiba Inu retested this gap, and bears defended the area, further adding downward pressure.
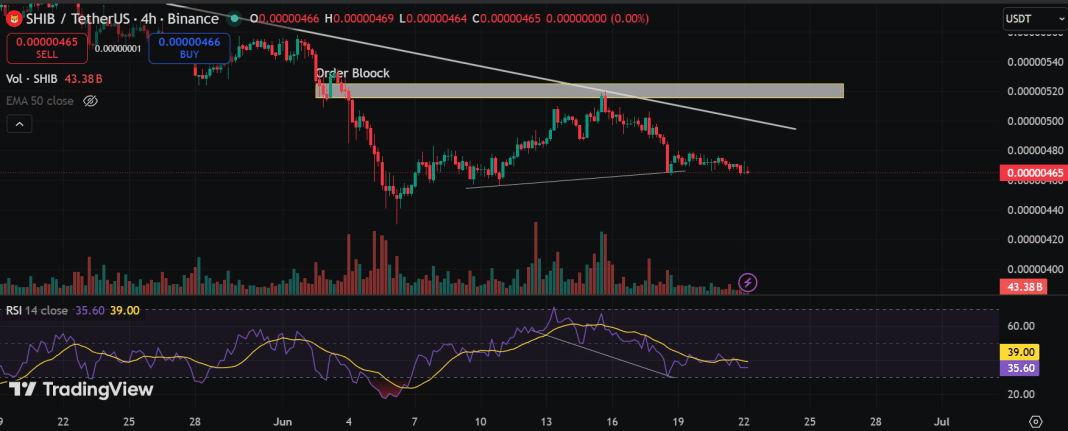
As long as the token remains below the current resistance area and continues trading within the order block and fair value gap zone, the path of least resistance appears lower.
Distribution Signs Suggest $SHIB Sellers in Control
Volume behavior adds another layer to the bearish outlook. A recent spike in trading activities showed characteristics often associated with distribution. Strong upward moves attract retail buyers while larger participants gradually reduce their exposure.
A buying climax, followed by a climactic volume spike, failed to produce a sustained breakout. Instead, price swept liquidity above the key trigger level at $0.00000520 before reversing and breaking below the lower trigger line. This development typically signals increasing supply.
If downside momentum accelerates, the first area to watch sits near $0.00000457, which is just 2% away from the current market price of $0.00000467. The next major support zone sits near $0.000004310, a 7.7% drop from here.
However, this bearish outlook could lose credibility. For this to happen, $SHIB would need to reclaim the $0.00000520 resistance level and decisively break out with strong volume. Until that happens, the technical picture continues to favor a further downtrend.
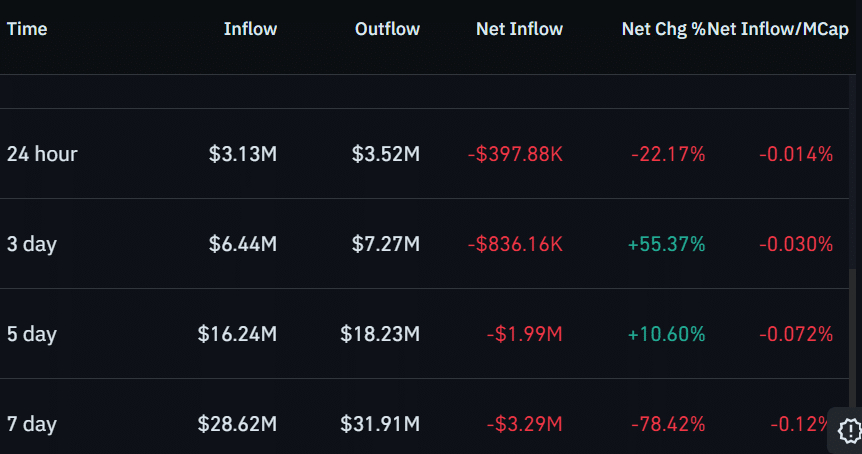
Notably, derivatives data already reflect this caution. Over the past 7 days, traders have closed more futures contracts than they have opened, as reflected in the Coinglass futures flow. Inflows stood at $28.6 million and outflows at $31.9 million.