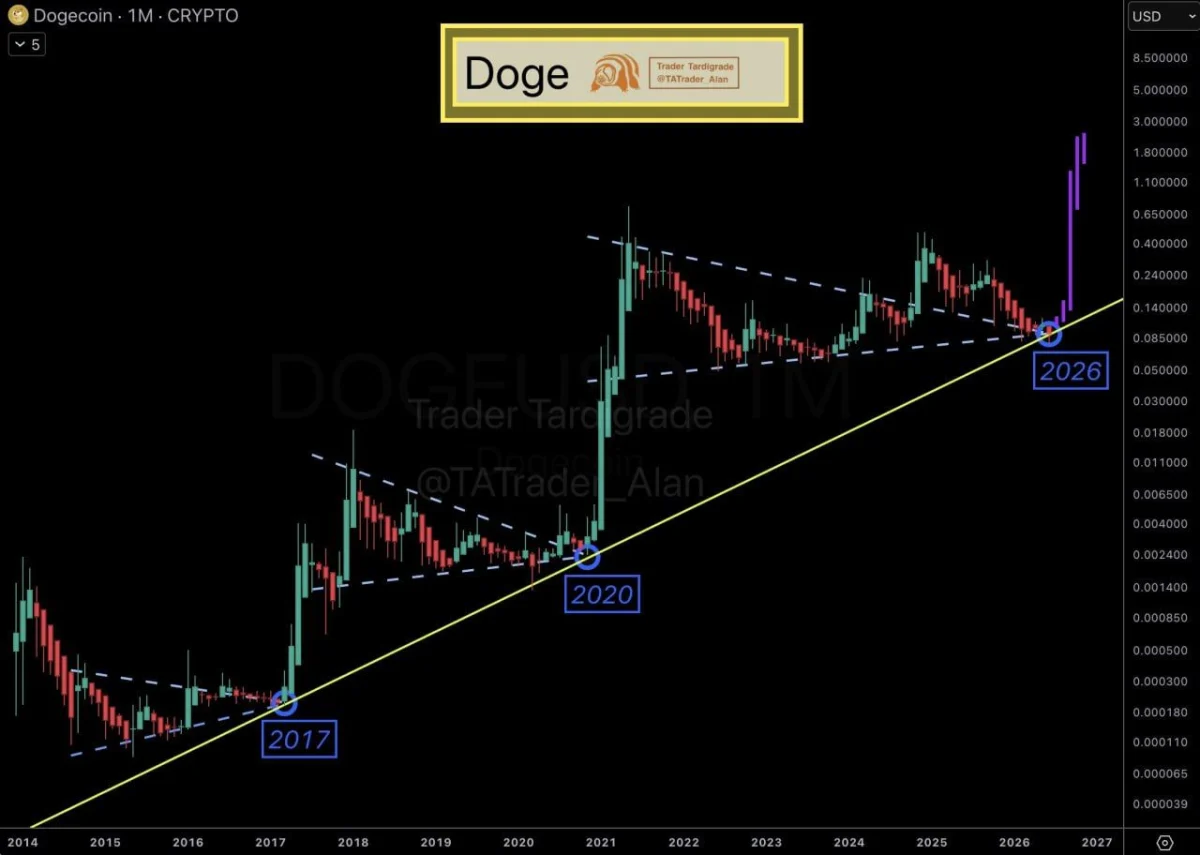
$DOGE/USD Monthly Triangle Pattern. Source: Trader Tardigrade (@TATrader_Alan) on X.
The analysis focuses on the alignment between triangle apexes and a rising long-term support trendline. In previous cycles, Dogecoin surged shortly after price compressed into the apex of a similar formation, triggering powerful upside moves.
According to Trader Tardigrade, the current setup closely resembles those earlier structures. The chart shows $DOGE once again reaching the point where the triangle apex meets the ascending trendline, a location that previously marked the start of major rallies.
For now, the key question is whether history will repeat. A breakout from the current consolidation range would strengthen the bullish case, while a failure to hold the long-term trendline could delay any potential upside move.
Dogecoin Nears Historic RSI Low as Analyst Sees Rebound Setup
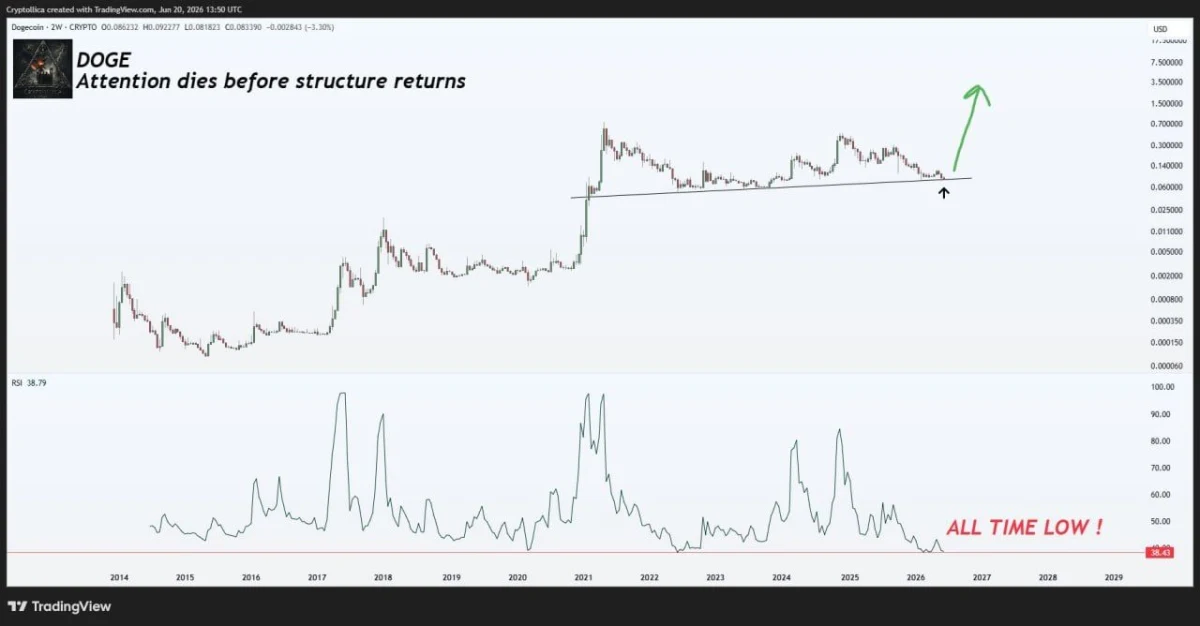
Dogecoin is trading near a long-term rising support trendline while its Relative Strength Index (RSI) sits at one of the lowest levels in the asset's history, according to analyst Cryptollica. The setup suggests market attention has faded, but historical structure remains intact.
$DOGE/USD 2-Week Chart. Source: Cryptollica (@Cryptollica) on X.
The chart highlights $DOGE holding above a multi-year ascending trendline that has supported price action through several market cycles. At the same time, the RSI has fallen to an extreme low level, a condition that has previously appeared near major cycle bottoms.
According to Cryptollica, weak sentiment and declining interest often emerge before stronger market structures return. The analysis suggests that if Dogecoin continues to defend long-term support, the current period of low momentum could eventually give way to a larger recovery.
For now, traders are watching whether $DOGE can maintain its position above trendline support. A successful hold would reinforce the bullish outlook, while a breakdown could delay any potential upside move.

 coinpaper.com