
$XRP has dropped nearly 5% after a Fed-induced risk-off move swept across crypto markets, though traders remain focused on bullish chart signals and a major liquidity cluster near $1.30.
The pullback began shortly after $XRP ($XRP) failed to break through the $1.25 resistance area. $XRP fell nearly 5% in 24 hours to an intraday low of $1.16 on June 18 as heavy spot selling intensified below the recently reclaimed $1.20 level, triggering stop-loss orders and leveraged liquidations.
$XRP also fell alongside a broader crypto market retreat after the Federal Reserve kept rates unchanged at 3.50%-3.75% while projecting additional tightening risks in 2026.
Despite the decline, $XRP has continued to attract attention from market participants looking for signs that the correction may be nearing exhaustion. Several technical indicators, derivatives metrics, and recent Ripple business developments have kept bullish sentiment alive even as macro conditions remain challenging.
$XRP technical structure remains intact above $1.16 support
The four-hour chart shows $XRP pulling back within a descending channel that formed after the token rallied toward $1.29 earlier this month. The asset’s price is currently testing the 23.6% Fibonacci retracement level near $1.165 while holding above an ascending trendline that has supported the market since early June.
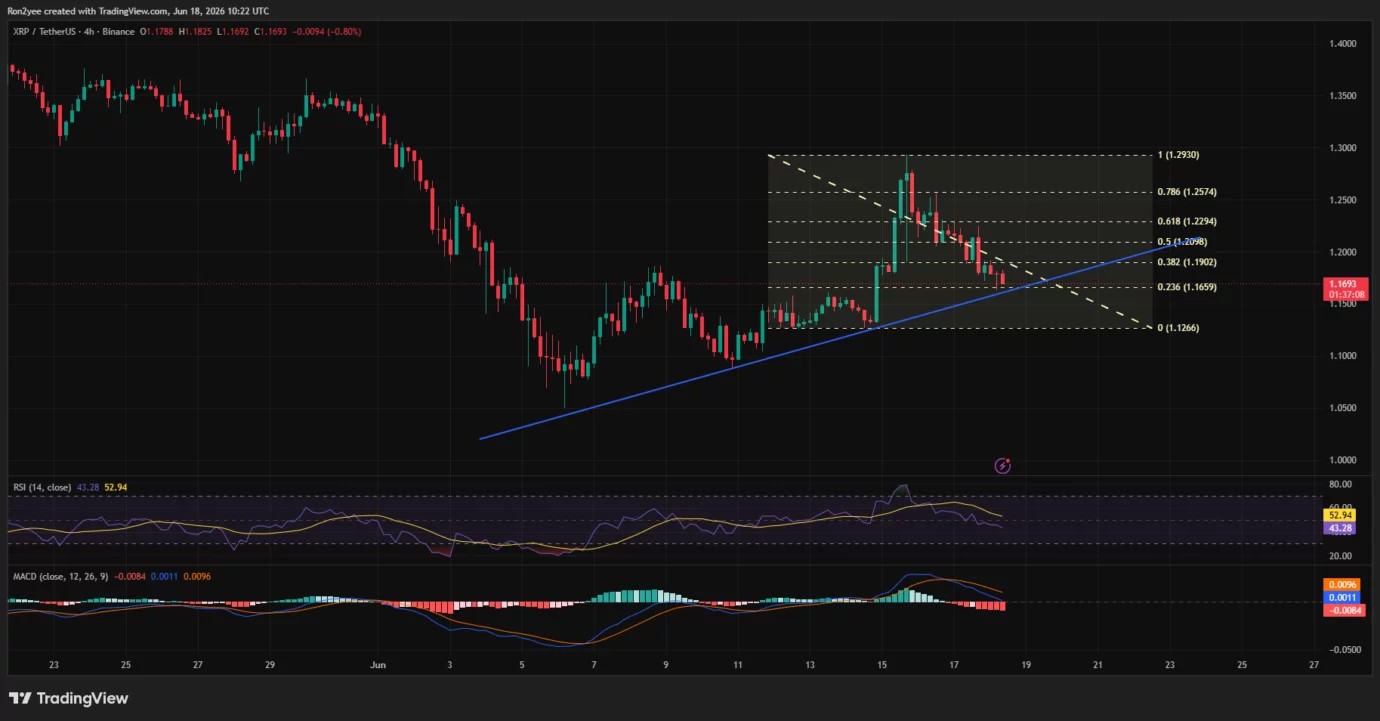
Momentum indicators have weakened but have not yet entered deeply bearish territory. The Relative Strength Index has retreated to around 43, while the MACD histogram remains below zero after a bearish crossover.
A decisive break below $1.16 could expose the June swing low near $1.12, while reclaiming $1.20 would place resistance levels at $1.23, $1.26, and ultimately $1.29 back into focus.
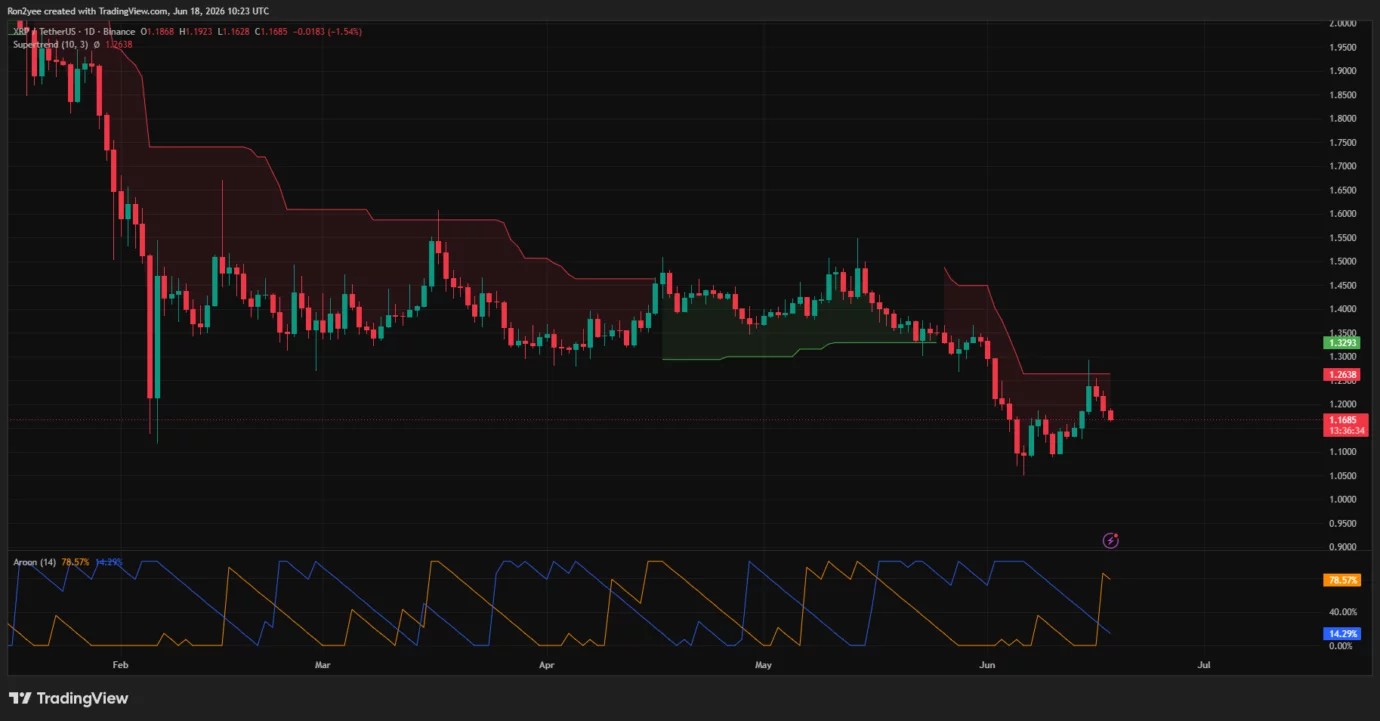
On the daily timeframe, $XRP remains below the Supertrend resistance level near $1.26. At the same time, the Aroon indicator shows Aroon Up above 78% and Aroon Down near 14%, suggesting the longer-term trend has not fully shifted in favor of bears despite the recent decline.
Several market commentators continue to watch for reversal signals despite $XRP’s recent weakness. According to analyst Gerla, the token has flashed a bullish divergence on the three-day chart.
“$XRP just flashed a bullish divergence on the 3D chart while trading inside a falling wedge. Momentum is turning higher even as price makes lower lows.”
Gerla argued that the divergence suggests selling pressure may be losing strength even as $XRP continues printing lower lows, raising the possibility of a breakout if buyers can reclaim nearby resistance levels.
Another trader, Nebraskangooner, highlighted a possible accumulation structure forming on the daily chart. Commenting on the setup, the analyst noted that confirmation would require “a break above $1.34,” which remains a key level to monitor for a larger trend reversal.
$XRP (per request)
— Nebraskangooner (@Nebraskangooner) June 16, 2026
Interesting chart… potential accumulation here.
Would look for confirmation of spring with break above $1.34 – key level to monitor. pic.twitter.com/Vaw5di6Bem
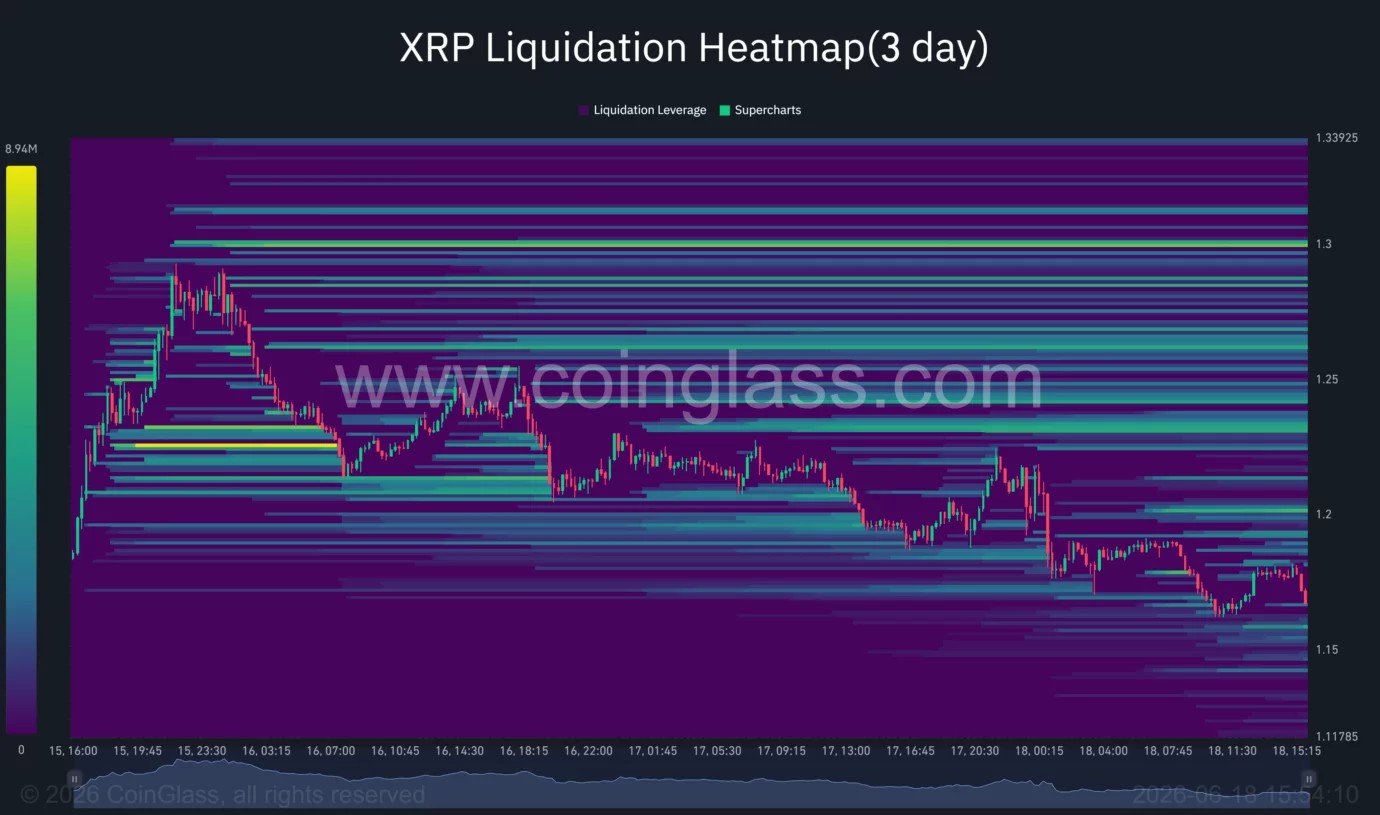
Derivatives positioning also reveals significant liquidity concentration above current prices. CoinGlass liquidation heatmaps show one of the largest leverage clusters sitting near $1.30, with additional liquidation pockets extending toward $1.34. Those levels could act as magnets for price if buyers regain control and trigger a short squeeze.
Ripple business expansion offsets some macro headwinds
Away from the charts, Ripple has continued expanding its payments ecosystem. Earlier this week, the company acquired an equity stake in African fintech firm Flutterwave in a transaction that valued the payments company at $3.3 billion.
While the deal does not include a commercial partnership, it gives Ripple exposure to one of Africa’s largest payments networks as Flutterwave continues expanding across the region.
Ripple has also raised expectations for its operating business. The company recently said it expects to finish 2026 with a $1 billion revenue run rate, excluding $XRP held on its balance sheet. The projection provides investors with another fundamental growth metric beyond $XRP price performance.
However, macro conditions continue to remain the primary risk factor for the token. Elevated oil prices, uncertainty surrounding Middle East tensions, and the Federal Reserve’s higher-for-longer policy stance continue to limit risk appetite across speculative assets. Any further deterioration in global market sentiment could pressure $XRP alongside the rest of the crypto market.
For bulls, holding the $1.16-$1.18 demand zone remains critical. Losing that support would invalidate the current recovery structure and increase the probability of a deeper move toward $1.12. A rebound above $1.20, however, could place the large liquidation clusters near $1.30 back into play and revive momentum toward the upper boundary of $XRP’s recent trading range.