
Cardano trades at $0.1647 on June 18, slipping 1.20% after Fed Chair Kevin Warsh held rates unchanged but announced the end of forward guidance, meaning every future FOMC meeting is now a surprise with no pre-signaled path. $ADA built into the decision and sold off on the conclusion, a pattern that has played out at nearly every FOMC meeting this cycle.
$ADA Daily Chart: Descending Channel Tightening With All EMAs Above Price
The daily chart shows $ADA locked inside a descending channel that has been compressing since January 2026. All four EMAs sit overhead in bearish order: 20 at $0.1846, 50 at $0.2122, 100 at $0.2428, and 200 at $0.3155. The horizontal support at $0.2200 that held the range from February through May gave way entirely in June and now acts as resistance.
Related: SkyAI (SKYAI) Price Prediction 2026, 2027, 2028, 2029, 2030-2050
The Supertrend at $0.1977 is the most relevant near-term level. A daily close above it would be the first meaningful signal that the downtrend is losing momentum. Without that, sellers retain control of every timeframe on this chart.
- Resistance: $0.1846 (20 EMA), $0.1977 (Supertrend)
- Support: $0.1600 (recent floor), $0.1500 (cycle low)
Why Is $ADA Price Falling After FOMC Today?
The FOMC decision itself was the least hawkish outcome possible. Rates held, the decision was unanimous, and no hikes were signaled. The selloff came from what Warsh said next. Forward guidance is gone. No projected rate cuts, no projected hikes, no timeline. Every meeting from here is a blank slate that markets will have to reprice from scratch 90 days at a time.
For $ADA specifically, uncertainty without a directional anchor is bearish in the short term. Crypto rallied into the meeting expecting clarity and got ambiguity instead.
What the 60-Day US-Iran Window Means for $ADA Price
The US released the full text of a 14-point memorandum of understanding with Iran on June 17. The key clause for markets is a commitment to negotiate a final deal within 60 days. The MOU already removed the naval blockade and Iranian oil tankers have begun transiting the Strait of Hormuz again, easing global energy supply concerns.
Roughly 80% of the deal is reportedly finalized with contradictions remaining around payments for Hormuz passage and the scope of sanctions relief. The 60-day negotiation window that begins with Friday’s signing is not a guarantee of resolution but it removes the acute escalation risk that had been weighing on oil prices and by extension rate expectations for months.
Related: o1.exchange (O) Price Prediction: O Token Jumps 112% as Open Interest Tops $4 Million
If oil continues lower through that window and inflation data softens, the 90-day FOMC meeting lands in a very different macro environment than today. That is the bull case for $ADA by late September.
$ADA Derivatives: Longs Are Getting Crushed While Shorts Barely Touch
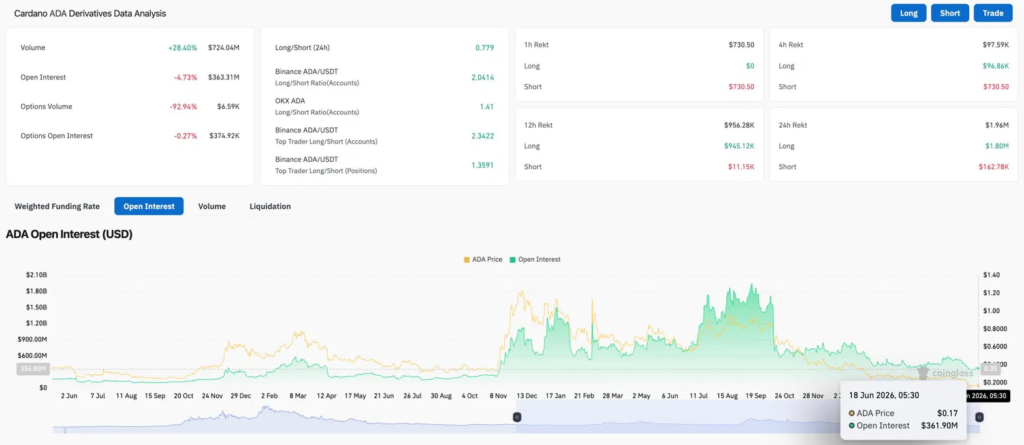
Volume rose 28.40% to $724.04M while open interest fell 4.73% to $363.31M. Rising volume with falling OI confirms position closures are accelerating rather than new bets being placed. The long/short ratio of 0.779 leans clearly bearish, the most bearish reading across all the assets covered this week.
Over 24 hours, $1.80M in long positions were liquidated against just $162.78K on the short side. Longs are absorbing more than ten times the pain of shorts right now. That level of one-sided liquidation reflects genuine directional selling pressure, not just noise around the FOMC decision.
Cardano Price Prediction for June 19, 2026
- Upside: A daily close above the Supertrend at $0.1977 would be the first technical signal the downtrend is breaking. Friday’s Iran deal signing removes macro uncertainty and could provide the catalyst for that move if broader markets respond positively.
- Downside: A close below $0.1600 removes the recent floor and puts the June cycle low at $0.1500 directly in play. With the long/short ratio at 0.779 and longs being liquidated at ten times the short rate, the path of least resistance stays down until the Supertrend flips.
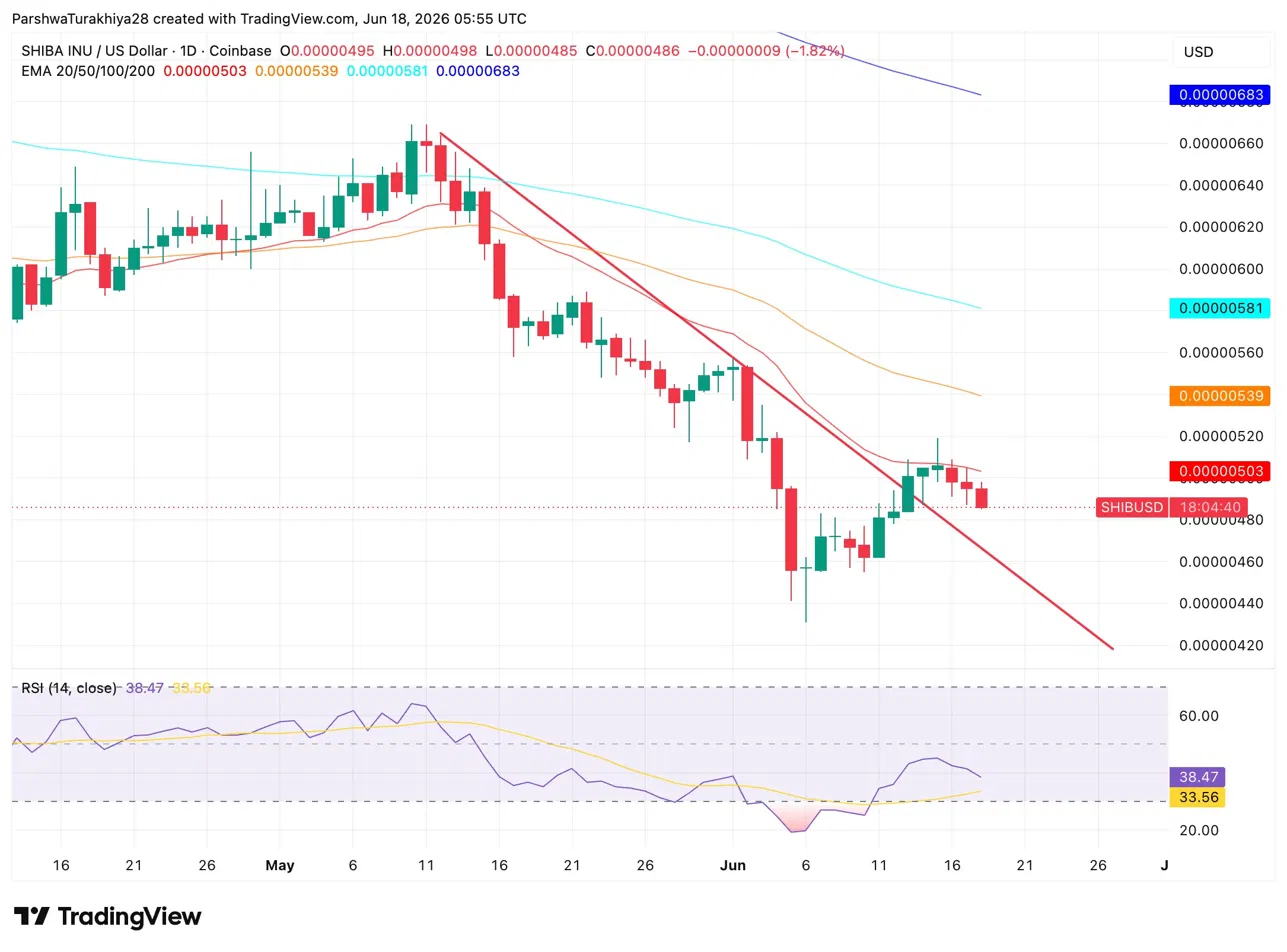
Related: Shiba Inu Price Prediction: SHIB Falls Below $0.000005 as 25B Tokens Flood Exchanges After the Bounce