
The S&P 500 could be approaching a key technical inflection point after an analyst identified the potential formation of a four-hour death cross, a bearish signal that last appeared in February 2026 before triggering a notable pullback.
According to TradingShot’s analysis shared in a TradingView post on June 16, the current market structure closely resembles the bearish megaphone pattern that developed ahead of the February decline.
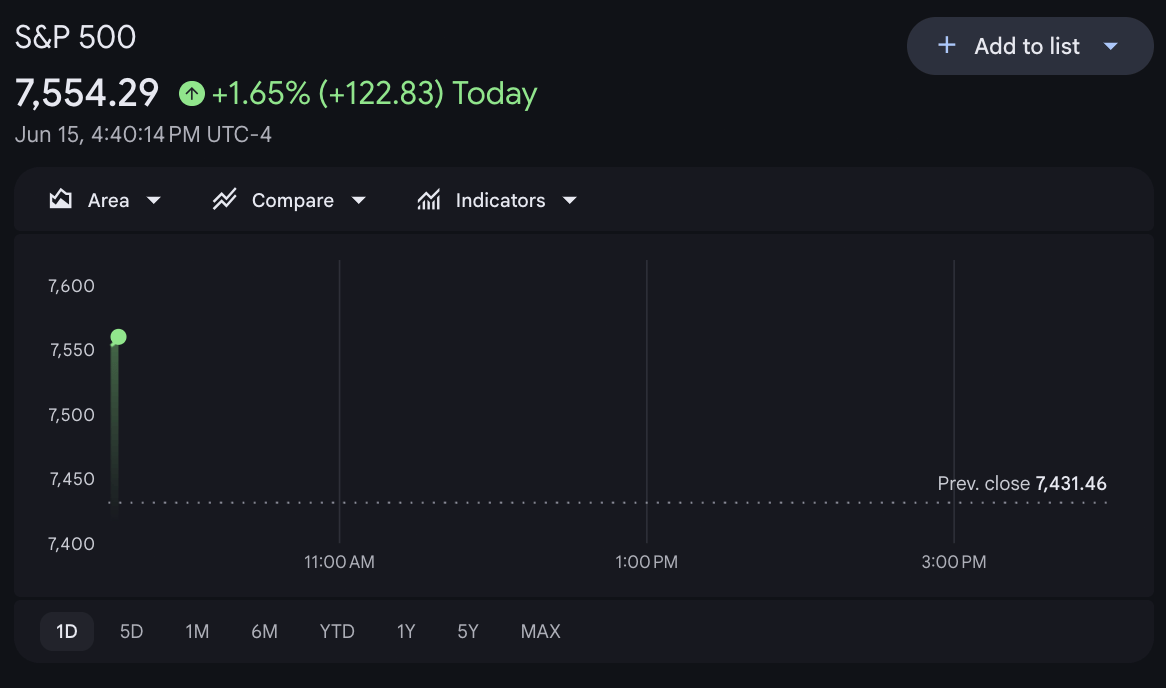
At the time, the four-hour death cross occurred while the index was testing the upper boundary of the pattern, marked by a series of lower highs. The same setup appears to be forming again. As of press time, the benchmark was trading at 7,554, up 1.6%.
TradingShot’s analysis shows the S&P 500 trading near the upper boundary of a bearish megaphone pattern while facing resistance from a series of lower highs.
A potential crossover of the four-hour 50-period moving average below the 200-period moving average would form a death cross, a signal that preceded a fresh bearish leg when it last appeared on February 12.
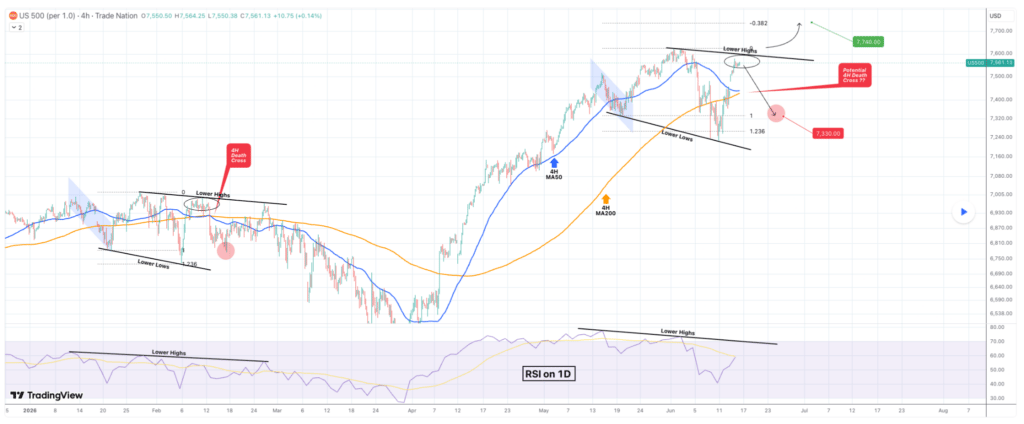
The setup is further supported by the one-day RSI, which is forming lower highs similar to those seen before the February decline.
Based on this historical fractal, TradingShot suggests a confirmed death cross could send the S&P 500 toward 7,330, the current 1.0 Fibonacci level and roughly 3% below current prices.
However, the bearish outlook depends on the death cross materializing and the index failing to break above its previous all-time high. TradingShot also highlighted a bullish alternative if resistance is cleared.
S&P 500 next target
If the S&P 500 breaks above its all-time high, represented by the 0.0 Fibonacci level on the chart, the broader uptrend could resume. In that scenario, the analyst sees an initial upside target at 7,740, corresponding to the -0.382 Fibonacci extension.
The bullish case is supported by strong market fundamentals. Recent earnings estimates point to robust profit growth across the index, while improving market breadth has seen sectors beyond large-cap technology participate in the rally.
Although the outlook highlights a potential short-term bearish signal, the longer-term trend remains positive.
The index is up more than 10% year-to-date and approximately 25% over the past year, supported by strong corporate earnings and continued investor demand for equities.
Wall Street’s year-end targets generally remain above current levels, with forecasts largely ranging between 7,700 and 8,100.