Solana has staged an impressive rebound after establishing a local bottom near $60.26. The recovery has lifted $SOL toward the $75 region, reviving optimism among market participants. Buyers have reclaimed several important technical levels during the recent advance.
However, the rally now approaches a decisive zone that could shape the next major move. Traders continue to assess whether strengthening momentum can overcome overhead resistance. At the same time, derivatives data and exchange flows reveal a more cautious market environment beneath the surface.
Technical Structure Signals Improving Momentum
$SOL currently trades around $75.18 after recovering from its earlier decline. The price now sits above the 20-day, 50-day, and 100-day exponential moving averages. This development suggests that short-term sentiment has improved considerably.
Moreover, the alignment of these moving averages supports the ongoing recovery narrative. The 20 EMA stands near $71.43, while the 50 EMA rests around $69.57. Additionally, the 100 EMA near $71.20 reinforces the importance of this broader support cluster.
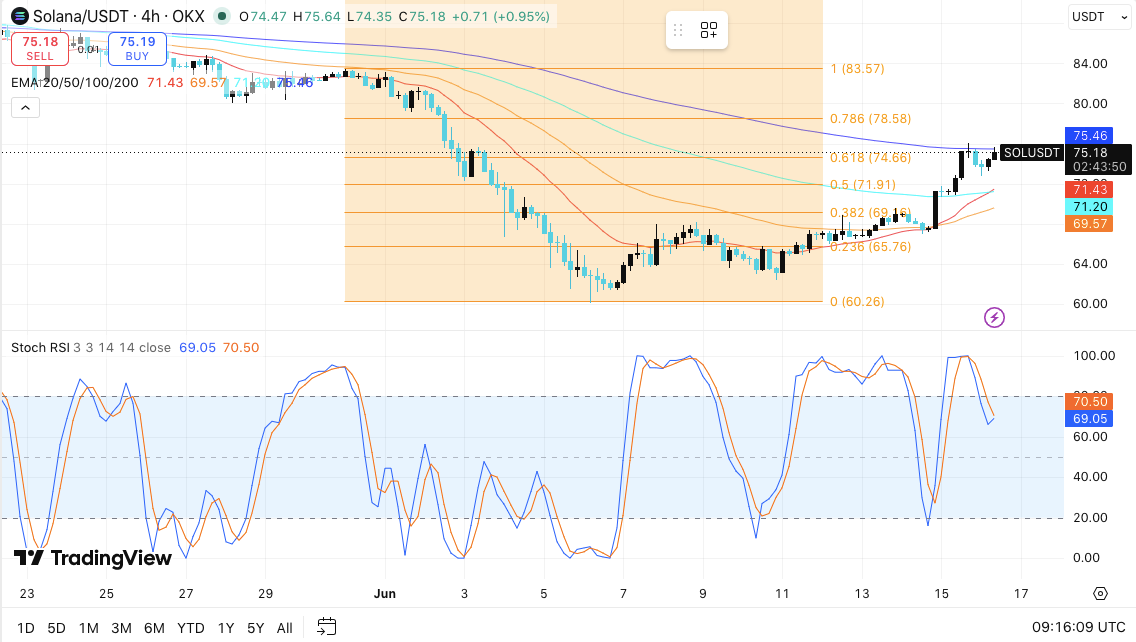
Despite these positive signals, bulls face an immediate challenge near $75.50 and $76.00. This zone coincides with the 200 EMA and a significant resistance barrier. A decisive breakout above this region could strengthen buying interest considerably.
Related: $XRP Price Prediction: $XRP Broke Every Level Below $1.25 and Now Faces Its Biggest Fibonacci Test
Consequently, traders may shift attention toward the next resistance level at $78.58. Beyond that, the $83.57 area represents a major upside objective. This level previously acted as an important supply zone during earlier market activity.
Support Levels Could Determine the Next Move
While momentum has improved, support levels remain equally important. The first notable support rests near $71.90, which aligns with the 0.5 Fibonacci retracement level.
Besides, the region between $69.16 and $69.57 provides another layer of protection. This area combines Fibonacci support with key moving averages. If selling pressure intensifies, $SOL could revisit the $65.76 support zone. The major swing low near $60.26 remains the final line of defense.
The Stochastic RSI has also cooled from overbought conditions. Therefore, buyers may pause before attempting another upward push. Holding above $71.90 would preserve the current recovery structure.
Open Interest and Exchange Flows Reflect Caution
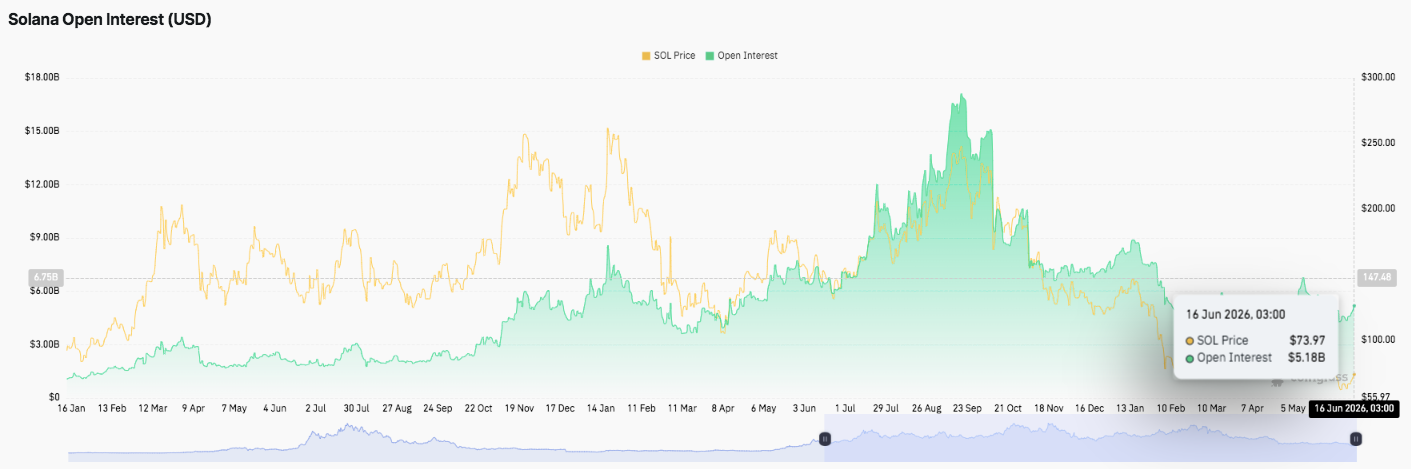
Derivatives activity tells a more measured story. Open interest previously climbed toward $17 billion during $SOL’s strongest rally phase. However, that enthusiasm faded as volatility increased across the market.
Open interest has since dropped to approximately $5.18 billion. This decline suggests traders have reduced leveraged exposure considerably. Consequently, participants appear more defensive following earlier liquidation events.
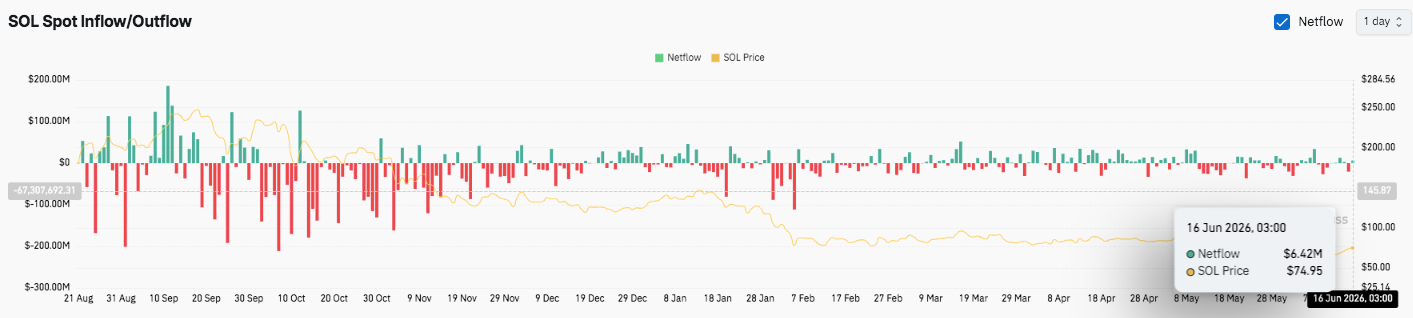
Spot market flows reveal a similar pattern. Persistent outflows dominated much of the observed period, highlighting ongoing distribution pressures. Although recent inflows have improved slightly, they remain inconsistent.
Related: Stellar (XLM) Price Prediction: Can Bulls Extend the Breakout Toward $0.25?
Significantly, these mixed signals create uncertainty around $SOL’s next direction. Technical indicators favor recovery, yet broader market participation remains restrained. The coming sessions may determine whether buyers can sustain momentum or whether another consolidation phase emerges.
Technical Outlook for Solana ($SOL) Price
Key levels remain clearly defined as Solana enters a recovery-driven consolidation phase heading into the next market move.
Upside levels: $75.50–$76.00 forms the immediate breakout zone, aligned with the 200 EMA. A successful break above this barrier opens the path toward $78.58 and $83.57 as the next upside extension targets. Sustained momentum beyond these levels could signal a broader trend reversal.
Downside levels: $71.90 acts as the first critical support tied to the 0.5 Fibonacci retracement. Below this, the $69.16–$69.57 EMA cluster provides a stronger defense zone. A deeper breakdown exposes $65.76, followed by the major swing low near $60.26.
Resistance ceiling: $75.50–$76.00 remains the key level to flip for short-term bullish continuation. This zone also aligns with the 0.618 Fibonacci resistance and the 200 EMA, making it a decisive battleground for trend direction.
The technical structure shows $SOL compressing between a rising recovery trend and a firm overhead resistance zone. Consequently, price action reflects a tightening range where momentum is building but not yet confirmed.
Will Solana Go Up?
Solana’s short-term outlook depends on whether buyers can maintain strength above $71.90. Holding this level supports the current recovery structure and keeps bullish momentum intact. However, rejection near $75.50–$76.00 could trigger a pullback toward the EMA cluster before another attempt higher.
Additionally, improving inflows may strengthen the bullish case if accumulation continues at current levels. However, declining open interest suggests cautious participation from leveraged traders. Hence, confirmation from volume and inflows becomes essential for continuation.
Related: Cardano Price Prediction: ADA Posts First Green Week Since May as Hoskinson ICO Controversy Heats Up
If bulls secure a clean breakout above resistance, $SOL could extend toward $78.58 and $83.57. Conversely, failure to hold support risks returning the market to a broader consolidation phase. For now, Solana remains in a pivotal zone where technical confirmation will decide the next directional move.