Dogecoin is showing a weekly bullish divergence, but price still remains trapped inside a wider range. Traders are watching whether $DOGE can build a recovery from current levels or retest lower support near $0.083 and $0.0816.
Dogecoin Flashes Weekly Bullish Divergence as Analysts Recall 2022 Setup
Dogecoin may be showing early signs of a trend reversal as a weekly bullish divergence emerges, a signal that previously appeared near the 2022 market bottom.
According to analyst Moe, the $DOGE/USD weekly chart shows price making lower lows while the Relative Strength Index (RSI) forms higher lows. This divergence suggests that bearish momentum may be weakening even as Dogecoin continues to trade near its recent lows.
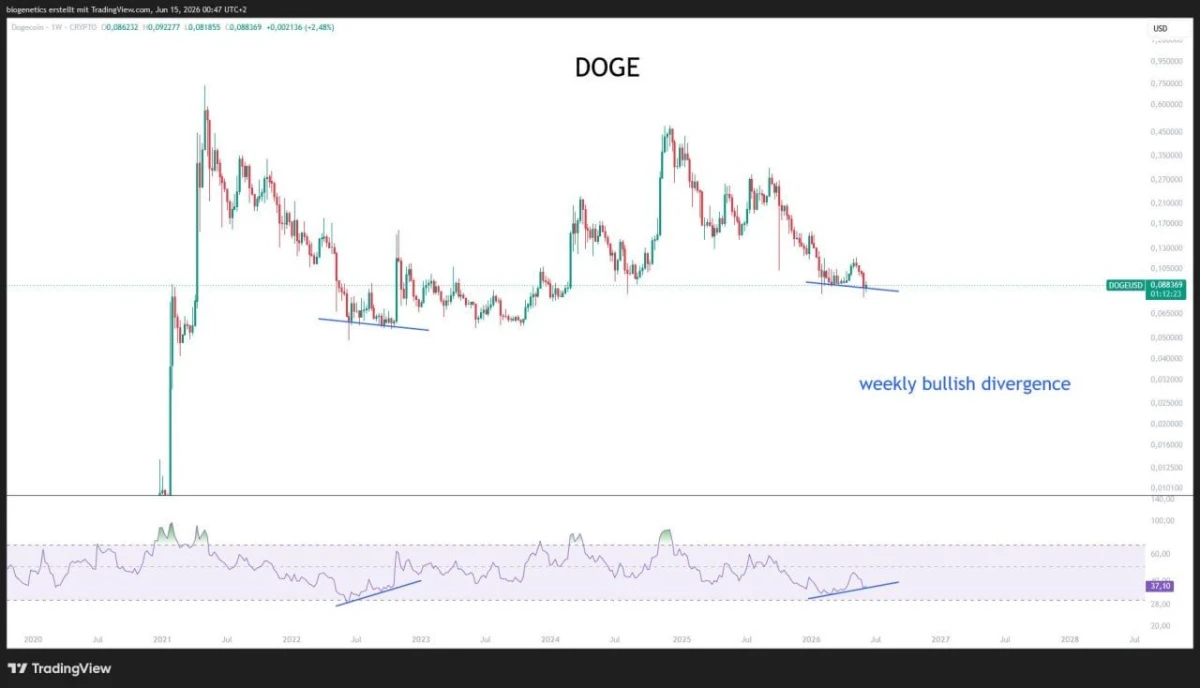
$DOGE/USD Weekly Chart. Source: Moe (@Crypto_Moe84)
The chart highlights a similar bullish divergence that developed in 2022 before Dogecoin eventually staged a meaningful recovery. The current setup appears to mirror that structure, with RSI turning higher while price action remains compressed near support.
In technical analysis, bullish divergences occur when momentum indicators begin improving despite declining prices. Traders often interpret the pattern as an early warning sign that selling pressure is fading and that a reversal could be developing.
However, the signal does not guarantee an immediate rally. Dogecoin still needs to confirm the divergence through stronger price action and a break above nearby resistance levels before the bullish case gains broader validation.
For now, traders are watching whether $DOGE can follow the path of its 2022 setup and turn weakening downside momentum into the foundation for a larger recovery.
Dogecoin Range Holds as Analysts Eye Lower Support Retest
Dogecoin continues to trade within a well-defined range, keeping the market structure intact despite recent volatility.
According to Umair Orakzai, the $DOGE/$USDT daily chart has yet to produce a daily close above the range high or below the range low. The analyst argued that this preserves a more predictable trading environment and keeps key levels in focus.
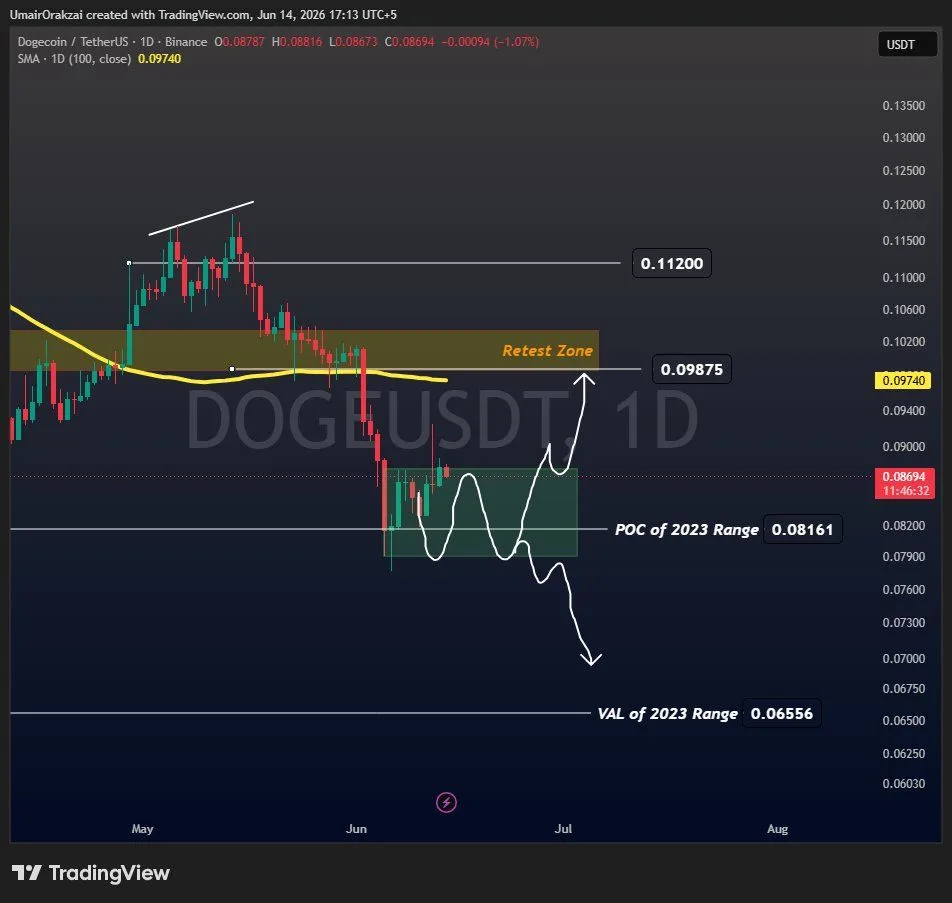
$DOGE/$USDT Daily Chart. Source: Umair Orakzai
The chart shows Dogecoin briefly sweeping the upper boundary of the range before retreating back inside. In range-based analysis, failed breakouts often increase the probability of price revisiting the midpoint and lower support levels before establishing a clearer directional move.
According to the analysis, the range midpoint near $0.083 is the first level to watch. If sellers maintain control, $DOGE could revisit the 2023 Point of Control (POC) around $0.0816, with the potential for an extended decline toward the Value Area Low (VAL) near $0.0656.
On the upside, a recovery toward the retest zone near $0.0987 would improve the short-term outlook and could open the door for another challenge of higher resistance levels around $0.1120.
However, the range remains valid until Dogecoin closes decisively outside its established boundaries. Until then, the current structure favors patience and disciplined reactions to the key levels.
For now, traders are watching whether $DOGE revisits the midpoint and lower support zones or reclaims momentum and pushes back toward the top of the range.