Historical patterns reveal when $XRP could finally reach its bottom for the ongoing market downturn, suggesting that prices could still go lower.
$XRP has continued to nurse losses this year despite the crypto market receiving a boost from the recent peace deal between the United States and Iran. While $XRP gained 4.8% over the weekend, it remains down 11% this month and 35% year-to-date.
As investors anticipate $XRP’s cycle bottom and the start of a potential reversal, pseudonymous yet notable market commentator PyraTime overlaid two $XRP bear cycles to ascertain that the asset could finally find a bottom in Q4 2026.
Similarities Between 2022 and 2026 $XRP Bear Cycles
In a recent analysis, PyraTime compared $XRP’s current bear market with the one that played out in 2022. During the comparison, he aligned both cycles using their pre-bull-run lows and then measured how prices behaved over time.
According to his findings, both cycles followed a very similar path. Around 680 to 700 days after their respective bear market bottoms, $XRP traded roughly 70% below its cycle peak in each case.
In the previous cycle, $XRP fell to about $0.58 in January 2022. This decline represented a 69.7% drop from the earlier peak of $1.96. The move came roughly 680 days after $XRP reached its March 2020 low of $0.1013 during the COVID-driven market crash.
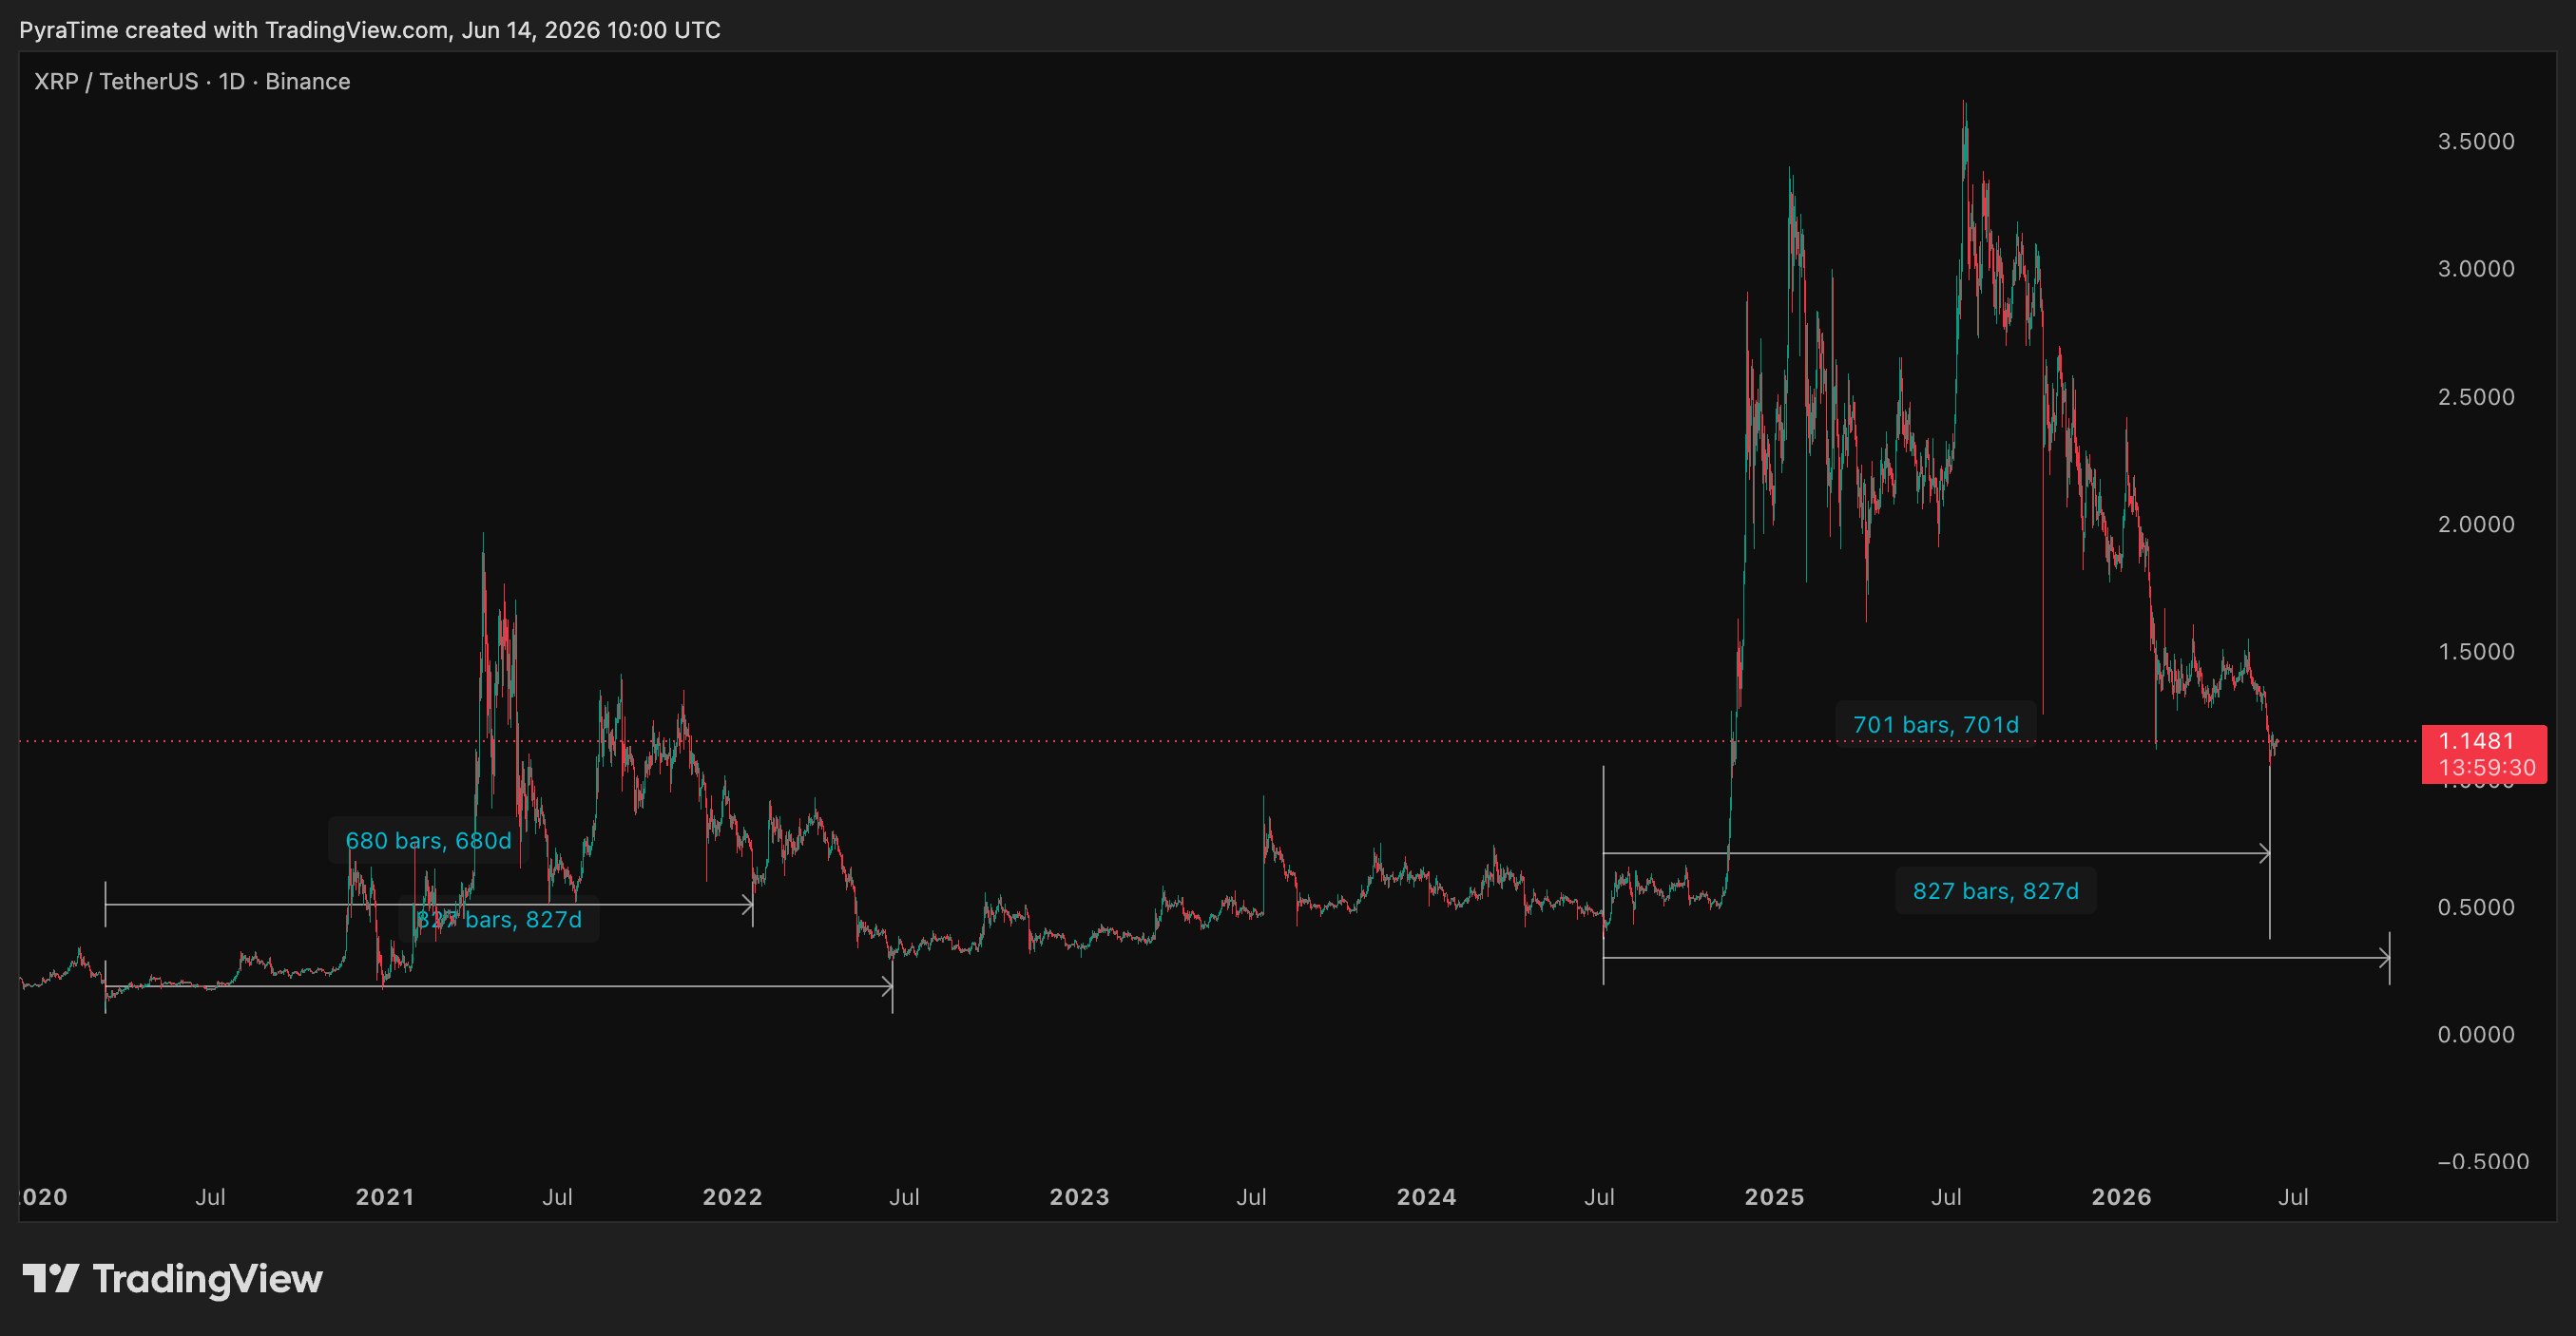
The current cycle mirrors this pattern. Notably, $XRP dropped to $1.05 on June 6, 2026, which placed it about 70.1% below its July 2025 high of $3.60. According to the analyst, this decline occurred about 701 days after the June 2022 market bottom of $0.2910.
Why $XRP May Not Have Reached Its Lowest Point Yet
However, despite the recent massive crash to $1.05, PyraTime believes investors should not assume that the decline marked the final bottom.
He pointed out that the previous cycle did not end when $XRP first reached the 70% drawdown level. Instead, the market continued falling for several more months before finding its true low.
The analyst noted that $XRP reached its final bear market bottom 827 days after the March 2020 COVID low. This bottom arrived on June 18, 2022, when $XRP traded around 84% below its previous peak, having collapsed to $0.2910.
This means the move to $0.58 in January 2022 was not the ultimate low. However, it served as an earlier stage in the broader decline before the market eventually reached its bottom months later.
When PyraTime applied the same 827-day count to the current cycle, the timeline pointed to Oct. 10, 2026. Interestingly, this date falls exactly one year after the sharp October 2025 flash crash that briefly sent $XRP down by about 56%.
Historical $XRP Trend Suggests October-November Bottom Window
Based on these comparisons, PyraTime argued that $XRP could still have more downside ahead. If the current cycle continues to follow the same general pattern as the previous one, the most likely period for a major bottom would fall between October and November 2026.
He also noted that the current cycle appears to be moving about 3% slower than the previous one. While the similarities remain strong, investors should see the comparison as a historical guide, not a prediction of future price action.
With this model, the analyst identified a possible bottoming range between Oct. 10 and Nov. 5, 2026. According to him, if the pattern continues to hold, $XRP could decline toward the $0.57 area before finally establishing a long-term floor.