Dogecoin has spent months moving through a difficult corrective phase, but analysis suggests it may be approaching another important turning point.
This assessment comes from MasterAnanda. In a recent TradingView analysis, he noted that the current consolidation might be a blessing, not the negativity that many see. The analyst highlighted that Dogecoin ($DOGE) has entered an “opportunity buy zone,” a rare chance to buy the leading meme coin cheaply before the next explosive move begins.
Dogecoin Is Testing a Proven Support Zone
A featured $DOGE/USDT weekly chart shows that the $DOGE price is once again testing a support zone that has repeatedly acted as a foundation for previous major moves. It highlights the consistency of the “critical extreme support” around $0.085–$0.075 in cushioning weak price momentum and starting a new wave of an uptrend since early 2024.
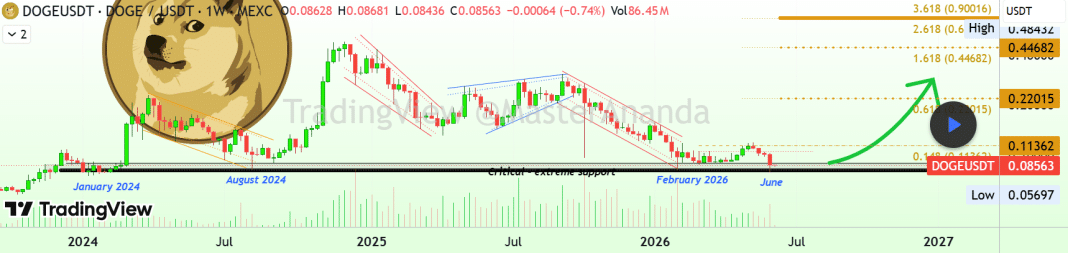
Dogecoin revisited this support in January and August 2024, when it reached lows of $0.074 and $0.080, respectively. It was also at this demand zone that the February crash bottomed. The token dipped to $0.080, and bulls once again stepped in to prevent further downside.
MasterAnanda noted that the area has been activated as a double bottom, a pattern that occurs when prices visit a level twice, each preceding a sharp rebound. This means that as long as $DOGE does not break this support amid persisting price weakness, it could turn out to be a final retest before a price expansion.
Declining Volume Suggests Bearish Momentum Is Fading
The Dogecoin price analysis also highlighted the behavior of volume during the ongoing correction as a signal of trend reversal. It shared that several major pullbacks have occurred between 2024 and now. Yet the volume chart does not show increasing selling pressure.
Instead, bear volume appears to be gradually declining as the correction progresses. This behavior matters for $DOGE because strong downtrends are typically accompanied by expanding volume as sellers become increasingly aggressive.
Here, the opposite pattern is occurring. The token continues to drift lower, but the selling momentum behind those moves appears weaker than during the early stages of the correction.
According to the analyst, this suggests that the market appears to be moving through a period of exhaustion where bearish momentum is gradually losing strength. He added that the fact that the market is taking this long to reverse the bearish price action suggests that a change of trend is occurring rather than a short-lived rebound.
The longer Dogecoin consolidates near support while volume contracts, the stronger the next bullish wave.
Dogecoin Bullish Wave Targets
The shared chart highlights possible targets if $DOGE manages to establish a lasting base at current levels and starts the next bullish wave. The first notable area is $0.11, which aligns with the 0.148 Fibonacci retracement level. The token would have to grow by 29% to reach this level.
Beyond that, the next major zone sits at the 0.618 retracement level near $0.22, representing a 159% growth. Above are the 1.618 and 2.618 Fibonacci extension levels at $0.44 and $0.67, respectively. From here, this represents an increase of 417% to 688%.