
Bitcoin has slightly recovered and is now trading above $63,000. Meanwhile, Solana’s $SOL has climbed above $65 after shedding nearly 20% over the past week.
However, Solana continues to trade under pressure amid weakening institutional inflows, deteriorating derivatives positioning, and persistent technical weakness across key indicators.
Spot ETF outflows break four-week inflow streak
$SOL underperformed last week thanks to declining institutional demand. Spot Solana ETF products recorded a net outflow of approximately $6.52 million last week.
This marks a sharp reversal from a four-week streak of positive inflows that began in early May, signaling a potential shift in institutional positioning.
Analysts warn that if outflows continue or accelerate, Solana could face additional downside pressure in the near term.
In addition to that, futures and derivatives markets are also signaling weakening confidence.
According to CoinGlass, Solana’s funding rate has turned negative and deepened to its lowest level since February, currently sitting around -0.0165%.
This indicates that short positions are paying longs, a setup that often reflects bearish sentiment in perpetual futures markets.
Historically, sustained negative funding rates have coincided with extended corrective phases following brief relief rallies.
However, Solana’s long-to-short ratio has climbed to 1.0129, suggesting that the bulls could be regaining control of the market.
The mixed derivatives data suggest that there is indecision among Solana traders after the coin bounced back from the Saturday low of $59.
Solana price forecast: Technical outlook remains fragile
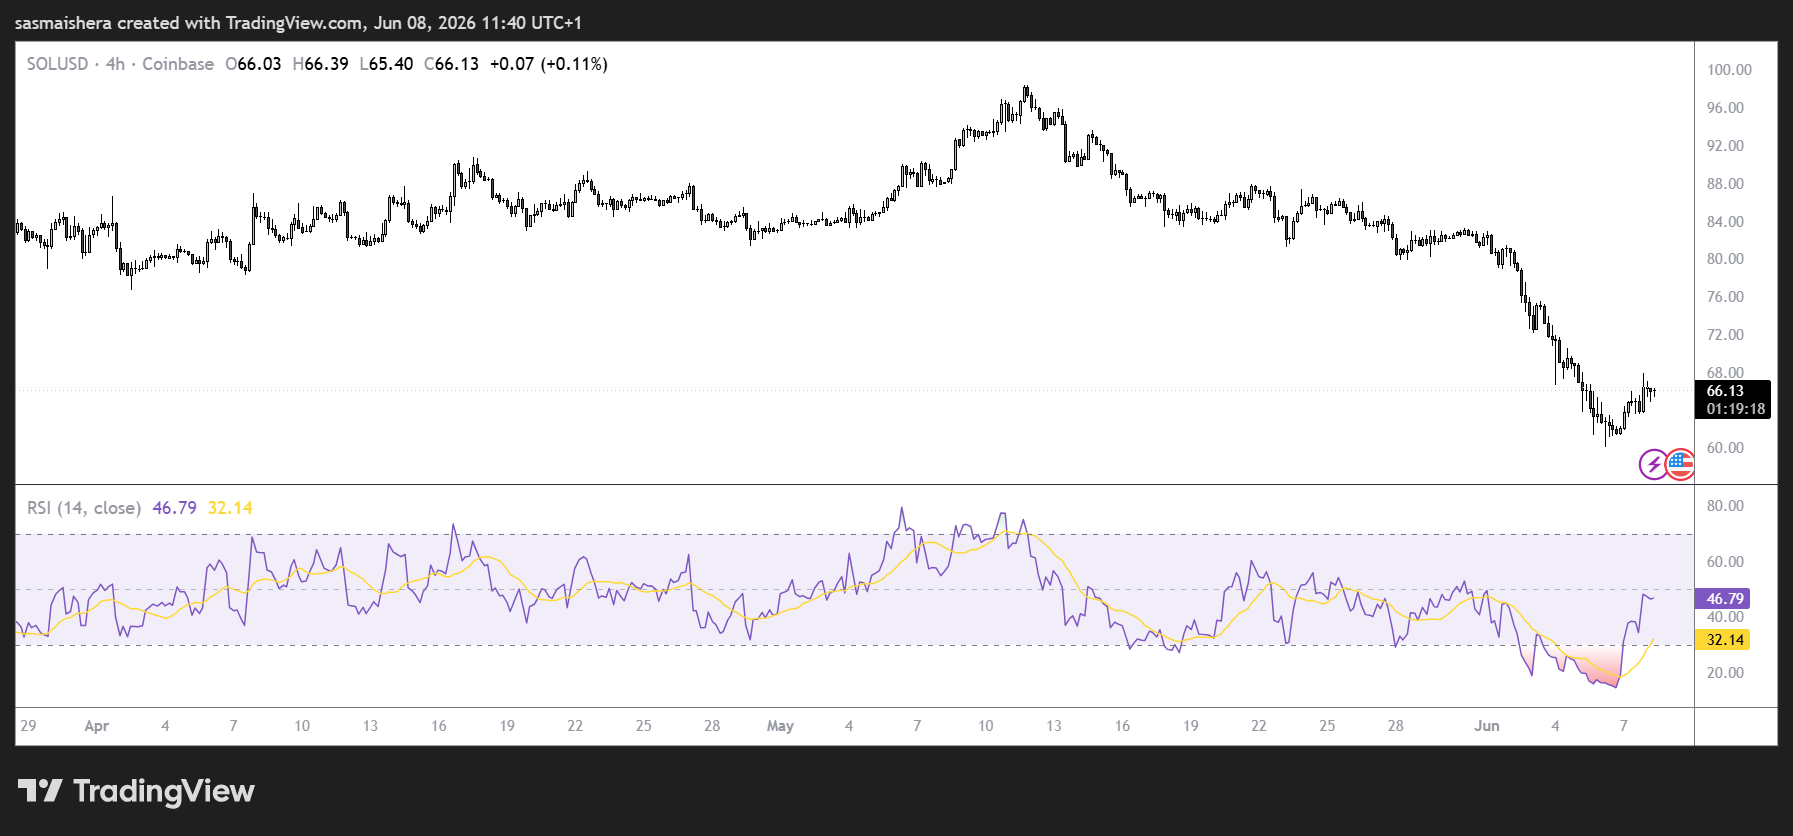
Similar to the other leading cryptocurrencies, the $SOL/USD 4-hour chart is extremely bearish following last week’s massive decline.
At press time, Solana is trading at $66, below the 50-day EMA at $81.50, 100-day EMA at $87.90, and the 200-day EMA at $104.00. This suggests that the bearish trend remains in place.
Momentum signals also remain weak. However, they are showing signs of recovery on the 4-hour timeframe.
The MACD continues to trend in negative territory, while the Relative Strength Index (RSI) sits near 47, indicating that Solana is now approaching the neutral zone.
The oversold conditions last week were followed by short-term rebounds, which could point to reversal signals on the lower timeframes.
If the bearish trend persists this week, the sellers would encounter immediate support at $60, a critical psychological and structural level.
A break below this zone could open the door toward $50, deepening the broader downtrend.
However, if the recovery continues, the bulls could face the first major resistance around the 50-day EMA at $81.50.
A daily candle close above this level could pave the way for Solana to retest higher resistance zones at $87.90 and $104.
The current market conditions suggest a relief bounce. However, the broader market structure remains weak.
Continued ETF outflows and negative derivatives positioning indicate that sellers still maintain control unless Solana can reclaim key resistance levels in the coming sessions.