Solana ($SOL) continues to face mounting pressure as sellers maintain control of the market following a steep decline from recent highs. The cryptocurrency now trades near $68.5 after losing several important support levels that previously helped stabilize price action. Market participants remain cautious as weakening sentiment, declining capital flows, and a fragile technical structure point to ongoing downside risks.
The latest sell-off gained momentum after $SOL broke beneath a major Fibonacci support level near $78.9. Consequently, the breakdown accelerated bearish activity and pushed the asset closer to a critical support zone around $66.8. Traders now closely watch this area because another decline could trigger a move toward the psychological $60 mark.
Technical Structure Remains Under Pressure
The broader chart structure continues to favor sellers. Solana currently trades beneath its 20-day, 50-day, 100-day, and 200-day exponential moving averages. This alignment highlights persistent weakness across both short-term and long-term timeframes.
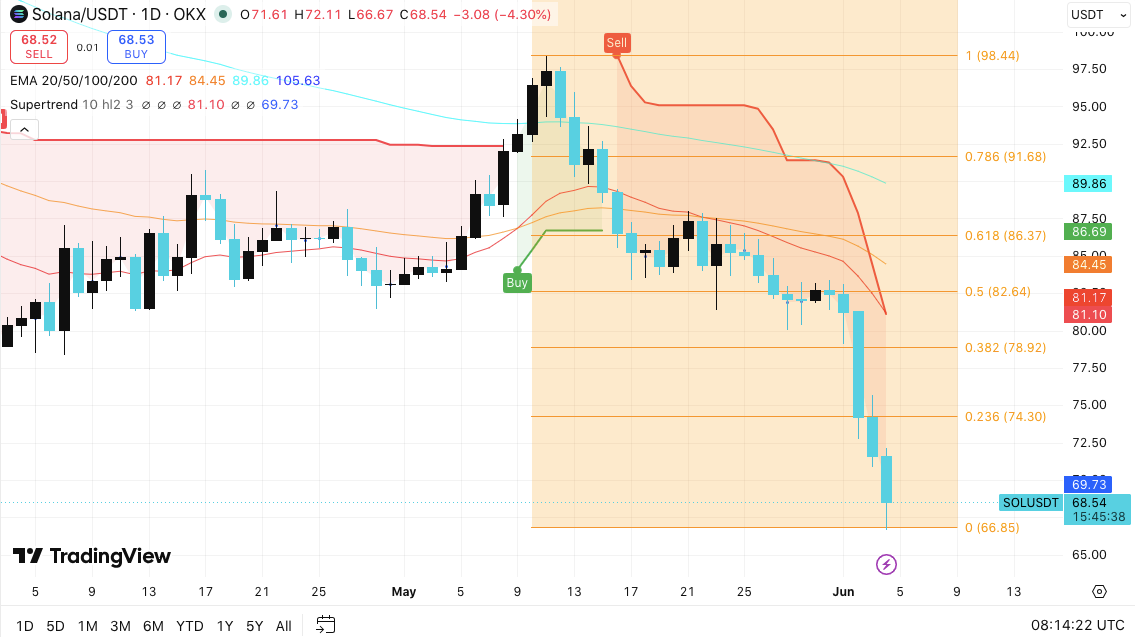
Moreover, the market continues to produce lower highs and lower lows, reinforcing the ongoing downtrend. The Supertrend indicator also remains in bearish territory after flipping negative near the $81 level. As a result, recovery attempts have struggled to gain traction.
Related: Worldcoin ($WLD) Price Prediction 2026-2050: Will $WLD Hit $1 Soon?
Immediate resistance appears near $74.3, while additional barriers sit around $78.9 and within the broader $82.6 to $86.4 recovery zone. Bulls must reclaim this range to improve sentiment and challenge the current bearish outlook.
Open Interest Signals Cautious Participation
Derivatives activity offers another perspective on market conditions. Open interest previously surged above $15 billion when Solana rallied toward the $250 to $280 range. During that period, speculative participation increased sharply as traders positioned for further gains.
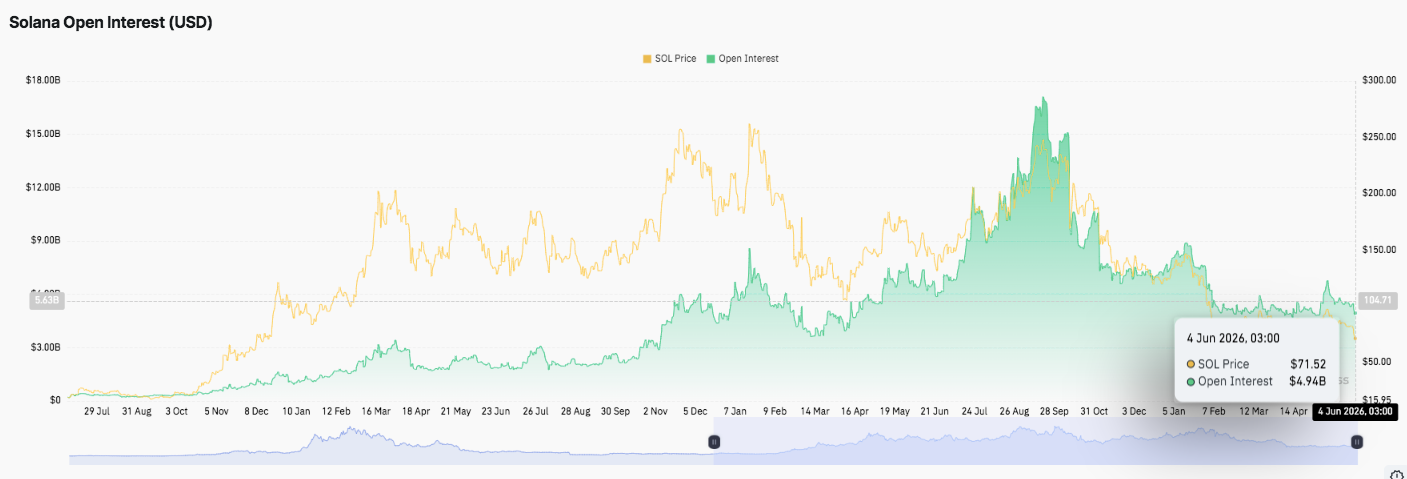
However, open interest contracted significantly after the rally peaked. Liquidations, profit-taking, and reduced leverage contributed to the decline. Today, open interest has stabilized near $4.9 billion while $SOL trades close to $71.
This stabilization suggests traders remain engaged in the market. However, many participants appear unwilling to increase exposure until a stronger directional catalyst emerges.
Capital Flows Reflect Weak Market Sentiment
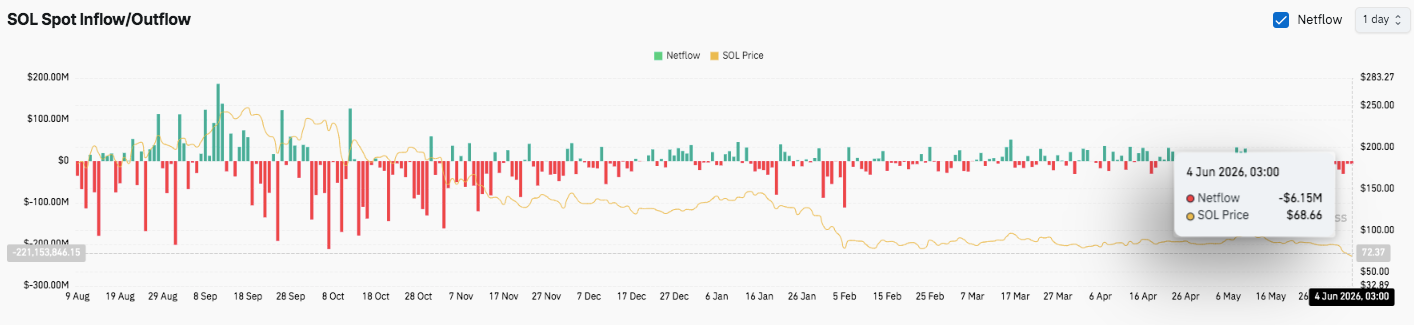
Spot market activity also supports the cautious outlook. Outflow data has consistently exceeded inflows across much of the observed period, indicating sustained selling pressure. Large capital exits dominated several months of trading, particularly during periods of price weakness.
Related: Hyperliquid ($HYPE) Price Prediction 2026-2050: Will $HYPE Hit $100 Soon?
Additionally, recent inflows have remained relatively modest compared to earlier distribution phases. The latest netflow reading of approximately negative $6.15 million points to continued, although less aggressive, capital outflows.
Technical Outlook for Solana Price
Key levels remain clearly defined as Solana trades near a critical support zone after an extended correction.
Upside levels: $74.30, $78.90, and $82.60 represent the first major resistance barriers. A sustained breakout above this cluster could open the path toward $86.40 and eventually the psychological $90.00 level.
Downside levels: $66.80 remains the immediate support and a key demand zone. If sellers force a breakdown below this level, $SOL could slide toward $60.00, with additional downside risk emerging near $55.00.
Resistance ceiling: The 20-day EMA near $81.10 remains the first major hurdle for any recovery attempt. Beyond that, the 50-day EMA at $84.40 and the Supertrend resistance around $81 reinforce the bearish structure.
The technical picture suggests $SOL remains trapped in a strong downtrend, characterized by lower highs and lower lows. However, price is approaching a historically important support region where buyers may attempt to stabilize the market. Open interest stabilization near $4.9 billion also indicates traders are waiting for a decisive directional move.
Will Solana Go Up?
Solana’s near-term outlook depends on whether bulls can defend the $66.80 support level and reclaim the $78.90–$82.60 resistance zone. Stronger spot inflows and improving market sentiment could support a recovery toward $86.40 and $90.00.
Related: Internet Computer ($ICP) Price Prediction 2026-2050: Will $ICP Hit $10 Soon?
However, continued outflows and weak momentum would increase the likelihood of a breakdown below support, exposing $SOL to the $60.00 region and potentially lower levels. For now, Solana remains at a pivotal technical juncture. The next major move will likely depend on whether buyers can regain control of key resistance levels while maintaining support above $66.80.