$XRP is trading at $1.16 today amidst a sustained structural breakdown, with momentum firmly in favor of sellers. The broader crypto market’s decline and the Fear & Greed Index sitting deep in Extreme Fear suggest that $XRP price today faces strong headwinds, making it difficult for the token to find a support level independently.
The Daily Chart: Structural Damage Done
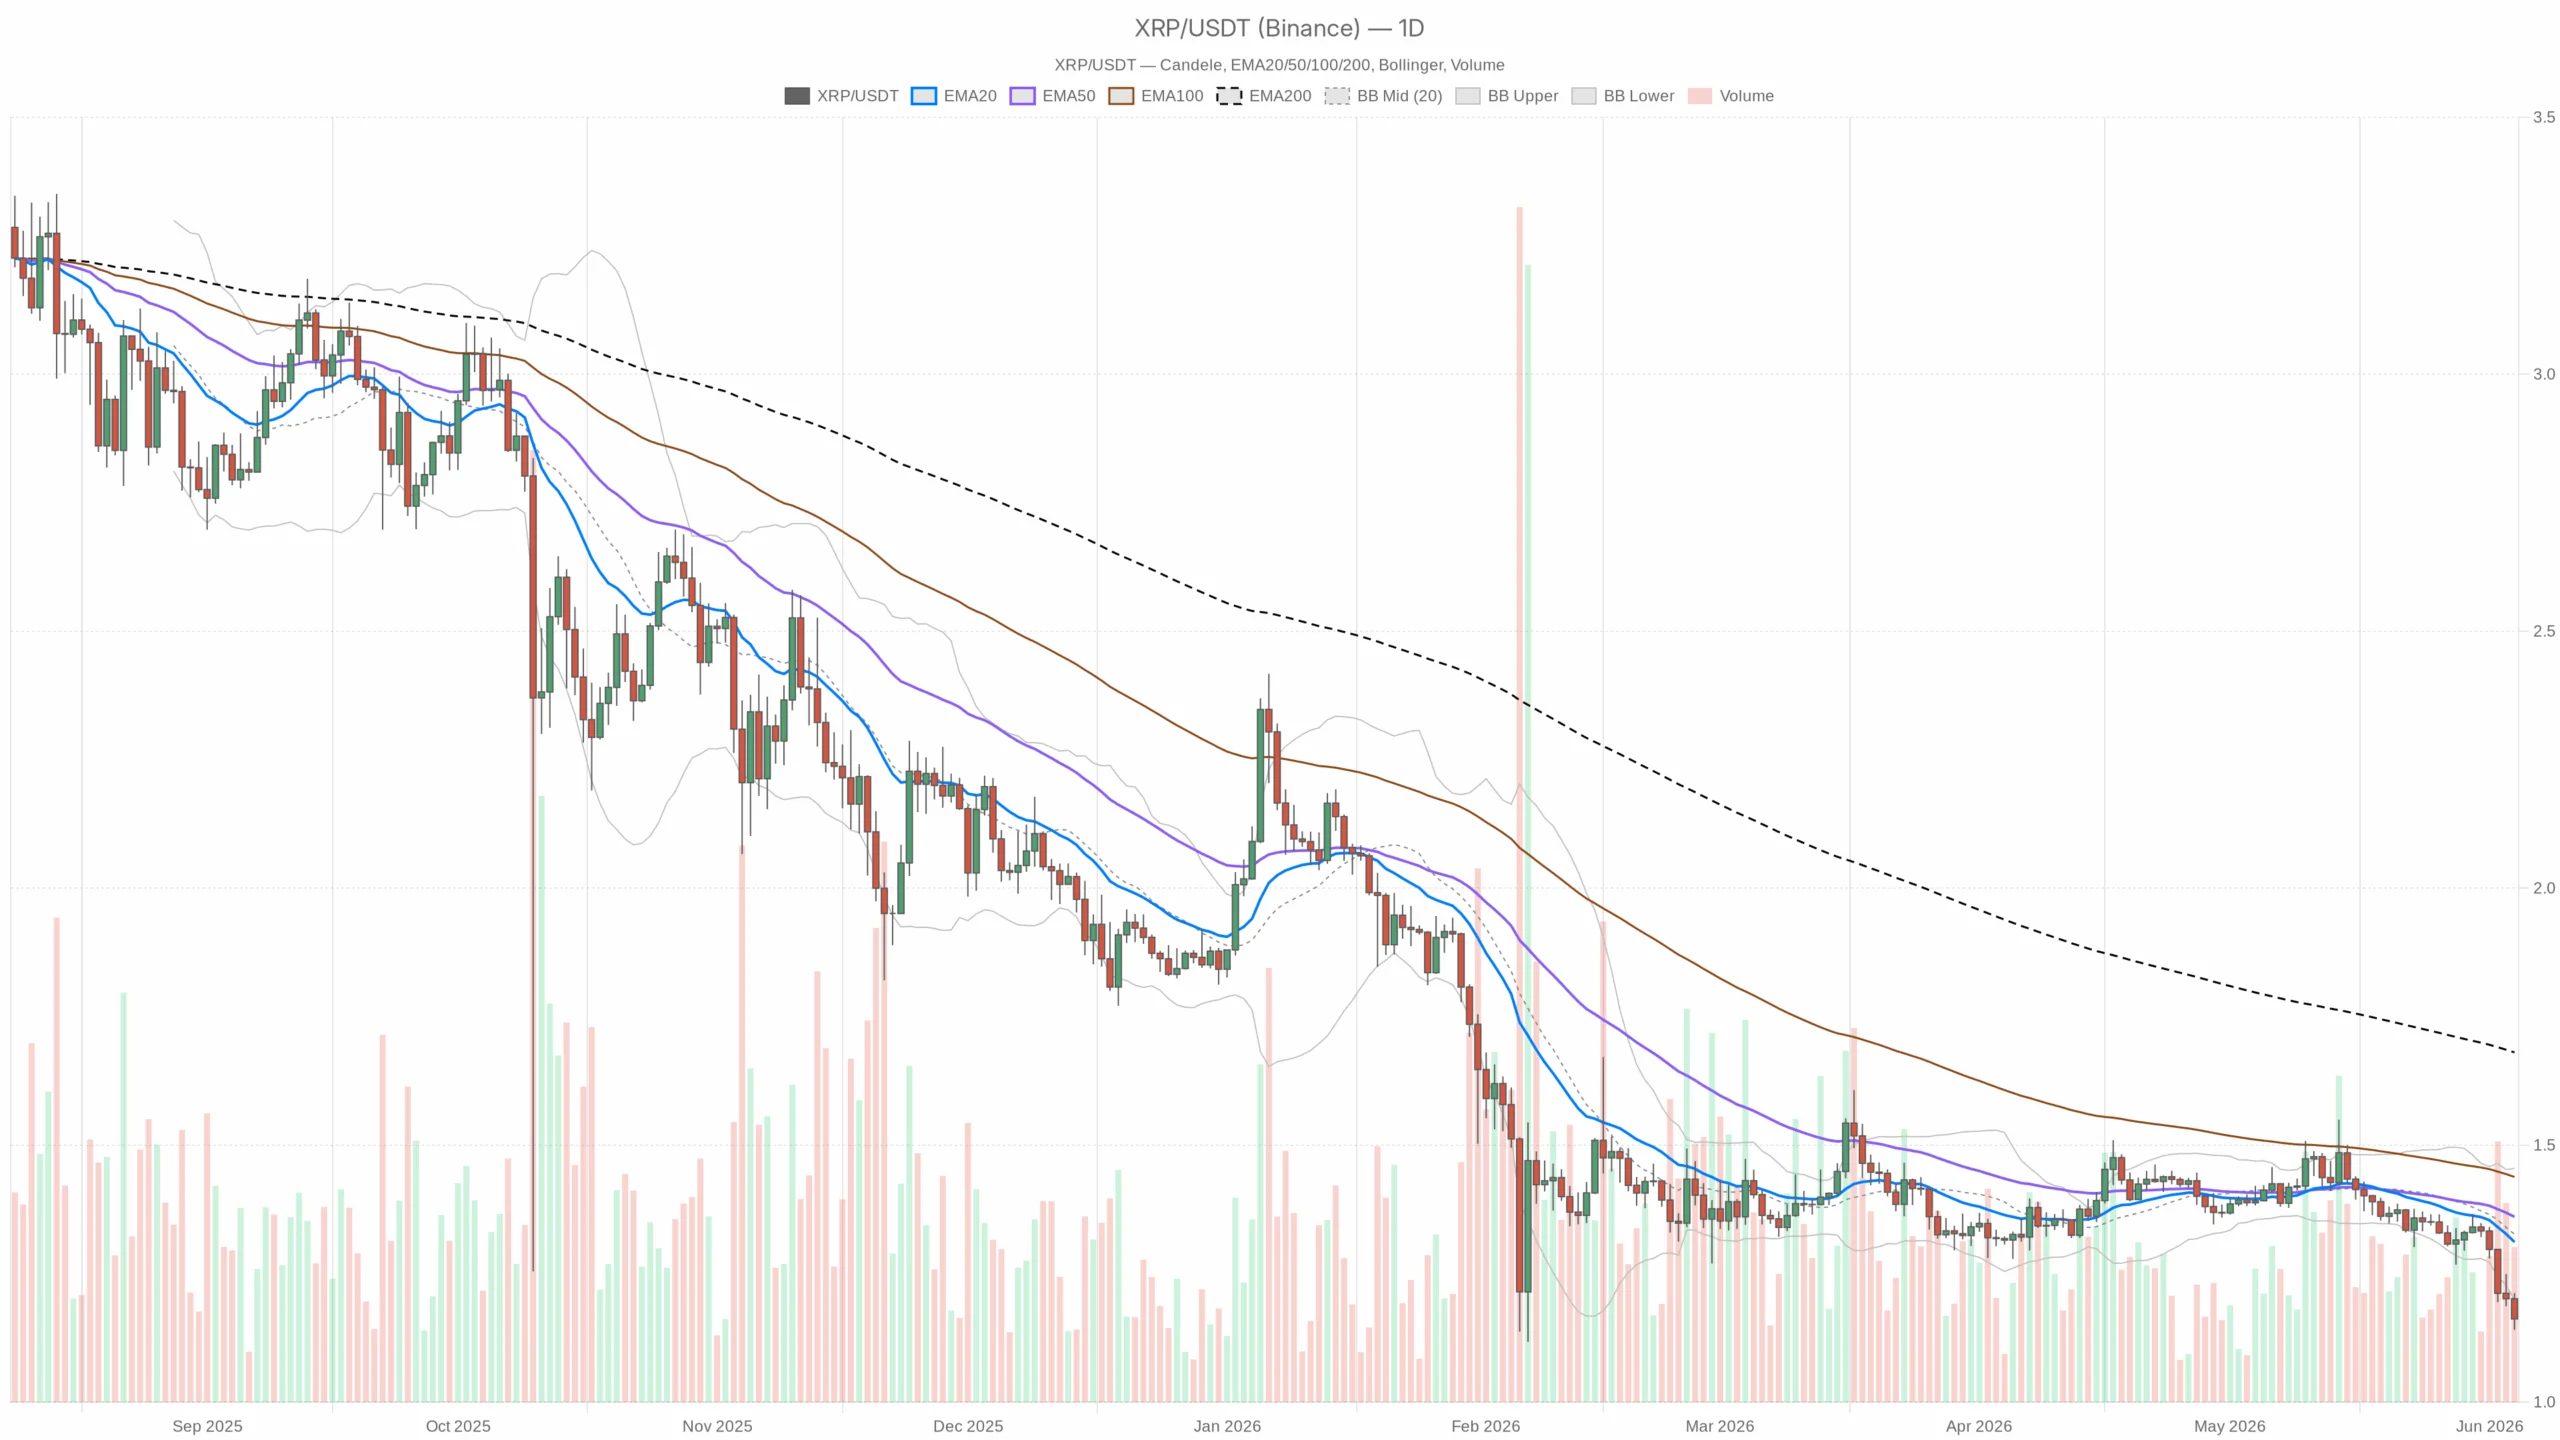
On the daily chart, $XRP trades well below its EMA20 at $1.31, EMA50 at $1.36, and EMA200 at $1.68, showing a clear bearish cascade. This level of breakdown reflects a loss of support across key dynamic averages. The EMA200 remains nearly 45% above the current price, emphasizing the severity of the decline.
The daily RSI at 22.92 signals an extreme oversold condition that rarely persists. Historically, such levels lead to either a strong bounce or consolidation before further downside. Meanwhile, the MACD remains bearish with the line below the signal and a negative histogram, indicating no reversal signs yet. The Bollinger Bands reveal the price hugging the lower band at $1.20, suggesting sustained downside volatility, while daily pivot points position resistance near $1.17 and $1.20, with support at $1.13.
Hourly Structure: No Recovery Attempt Worth Trusting Yet
The hourly chart shows $XRP below EMA20 at $1.19, EMA50 at $1.22, and EMA200 at $1.28, maintaining the bearish structure. The RSI at 35.09 remains low but not oversold, implying further downside could unfold before sellers lose momentum. The MACD histogram is flat, signaling a pause rather than reversal in selling pressure. Tight pivot compression suggests an imminent breakout in either direction within the short term.
15-Minute Context: Execution Zone, Not Yet a Signal
Similarly, the 15-minute chart displays bearish EMA stacking above price, an RSI near 35, and a flat MACD with no clear momentum shift. This timeframe shows a halt in price acceleration downward but lacks confirmation of a reversal. A break below the lower Bollinger Band at $1.15 could extend losses toward the daily support at $1.13.
Bullish Scenario: The Oversold Bounce Play
The rare daily RSI compression below 23 hints at a potential relief rally if $XRP can regain the $1.17 pivot and break through the $1.20 resistance. This aligns with daily R1 and the mid Bollinger Band. Targets then shift to the $1.24–$1.28 range, where hourly EMA200 and upper Bollinger Band converge. Positive developments, such as favorable legal news or a Bitcoin-led market recovery, could accelerate this outcome. However, a daily close under $1.13 would invalidate this bullish case.
Bearish Scenario: Capitulation Still in Progress
The bearish setup remains dominant with price beneath all major moving averages and no MACD reversal in sight. If total market capitalization declines further and Bitcoin dominance rises, liquidity for altcoins like $XRP could dry up quickly. The key level to watch is support at $1.13; a close below this may lead to testing psychological $1.00 support, about 14% below current levels. The bearish scenario only breaks down if price sustains above $1.20 consistently.
Where Does This Leave Traders?
$XRP today calls for patience rather than conviction. The extreme oversold indicator creates a tempting setup, but the Extreme Fear macro environment and significant market cap losses suggest caution. Long positions from higher levels should have clear invalidation points. Traders eyeing a bounce must manage risk carefully due to high volatility and potential rapid price swings, as indicated by the $0.05 ATR.
Key levels to monitor are $1.13 on the downside and $1.20 on the upside. How $XRP reacts around these in the next day or two will better inform the next directional move, as the chart currently signals a tense standstill between bulls and bears.