
Dogecoin is testing the $0.09 support zone after a sharp daily decline. At the same time, a long-term chart keeps the $10 target alive if $DOGE holds its multi-year trend.
Dogecoin Price Tests Key $0.09 Support as Selling Pressure Intensifies
Dogecoin fell more than 7% on the daily chart and closed near $0.0938, putting the meme coin directly above the $0.09 support zone highlighted by analyst KrissPax.
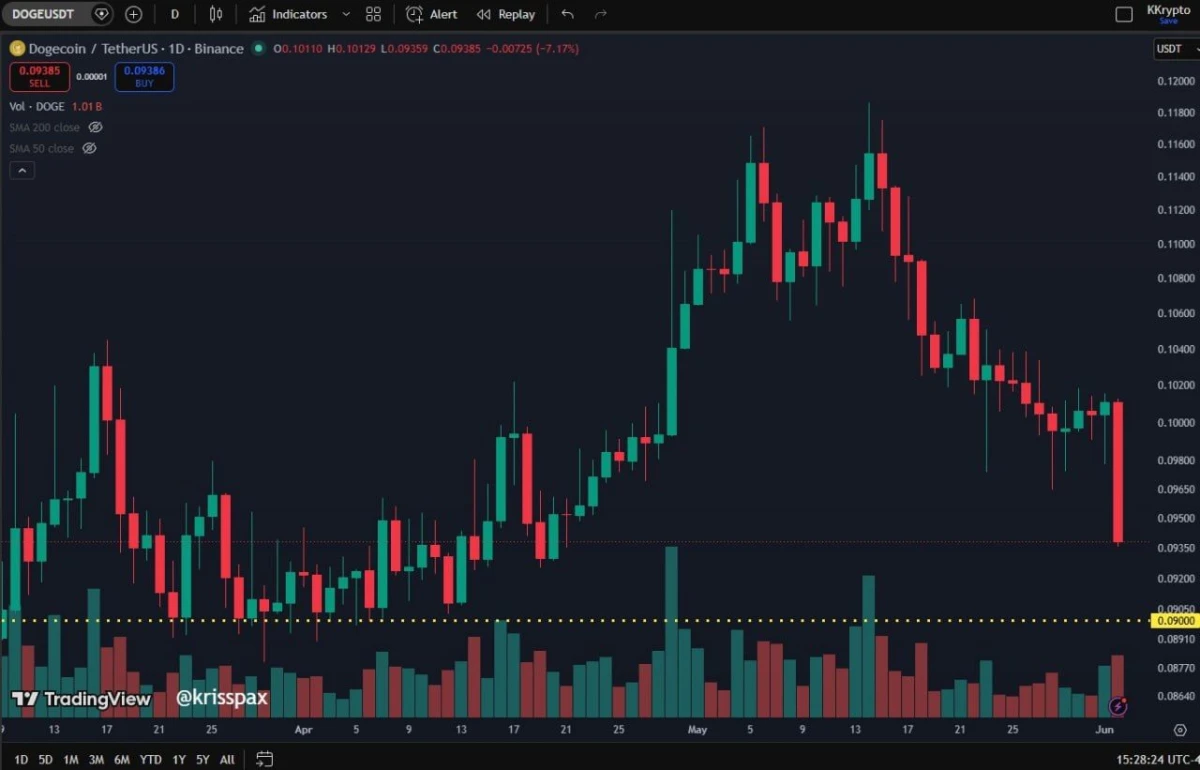
Dogecoin 9 Cent Support. Source: TradingView / KrissPax on X
The chart shows $DOGE breaking below a short-term consolidation range around $0.10-$0.102. A large bearish candle accompanied the decline, suggesting sellers remain in control. Volume also increased during the move, indicating stronger participation in the sell-off.
The $0.09 level stands out as the next major support. $DOGE traded around that area in early April before starting a rally that later pushed the token above $0.11. As a result, traders may view this zone as an important test of market demand.
On the upside, $DOGE would need to reclaim $0.10 and then $0.102-$0.105 to reduce immediate downside pressure. However, the current chart structure shows lower highs and lower lows, which remains consistent with a short-term downtrend.
If the $0.09 support fails to hold, the next downside area appears near $0.087-$0.088, based on previous swing lows visible on the chart. Conversely, a successful defense of $0.09 could trigger a relief bounce as buyers attempt to regain control.
Dogecoin $10 Prediction Relies on Long-Term Channel Support
A chart shared by Vuori Trading suggests Dogecoin remains inside a multi-year ascending channel that has guided price action since 2014. The analyst argues that $DOGE continues to follow a recurring pattern of accumulation, breakout, pullback, and expansion phases.
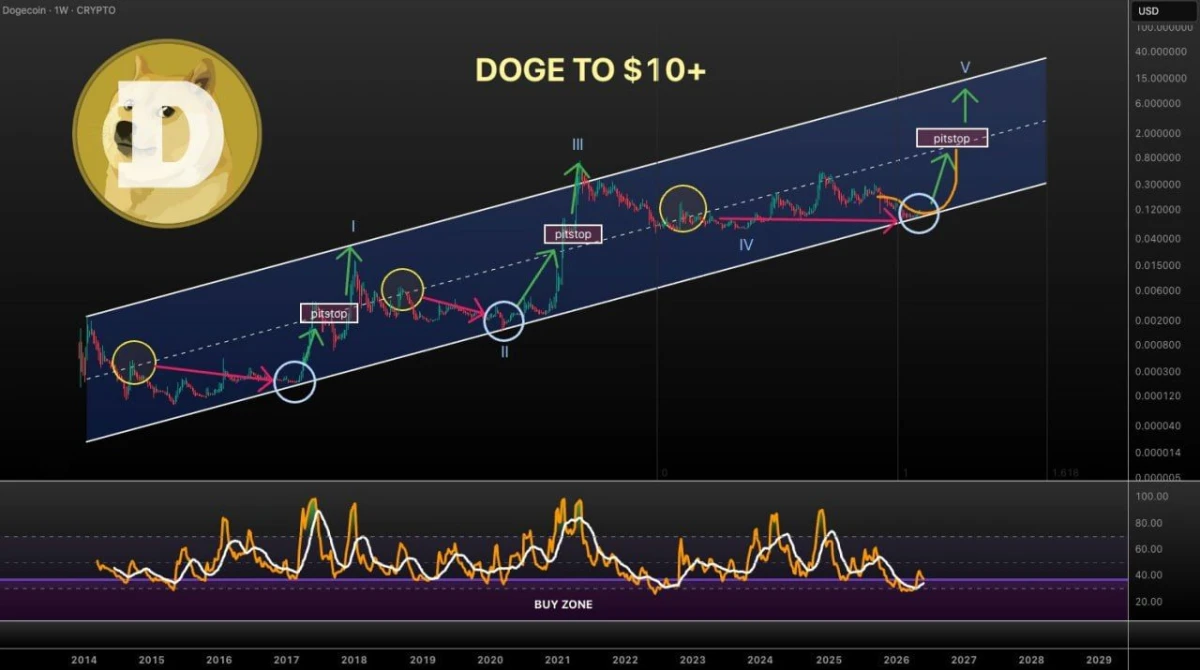
Dogecoin Weekly Ascending Channel Analysis. Source: Vuori Trading on X / TradingView
The chart marks five major cycle waves, labeled I through V. Previous bull runs began after $DOGE retested the lower boundary of the channel, highlighted by blue circles. Each retest was followed by a sharp upward move toward the middle or upper portion of the trend channel.
According to the analysis, $DOGE is currently revisiting channel support near the lower trendline. The setup resembles previous cycle lows seen before the 2017 and 2021 rallies. The chart also highlights a Relative Strength Index (RSI) reading near the historical buy zone, where earlier market bottoms formed.
Vuori Trading projects that a successful defense of current support could start the next major advance, labeled Wave V. The analyst's upper-channel target points to a potential move above $10, although that scenario depends on $DOGE maintaining its long-term trend structure and repeating previous market cycles.