Solana price has remained trapped between $80 and $83 since May 28, as weak network activity and a cautious macro backdrop have kept buyers on the sidelines.
According to market data, $SOL has struggled to build momentum despite repeatedly defending the $80 area, a level that several analysts view as one of the most important support zones on the chart.
The lack of upside follow-through comes as activity across Solana's memecoin sector continues to cool.
Over the past year, speculative trading, launchpad activity, and elevated decentralized exchange volumes played a major role in driving demand for the network.
As interest in many of those tokens faded and prices collapsed, transaction activity declined alongside it, reducing one of the ecosystem's strongest sources of demand for $SOL.
Pressure has also come from the supply side.
Scheduled token distributions linked to the FTX bankruptcy process have continued to release $SOL into the market, while early investors and venture capital participants have also gained access to previously locked tokens.
Those additional coins entering circulation have created a steady stream of selling pressure that the market has struggled to absorb.
Outside the crypto sector, geopolitical tensions have added another challenge for risk assets.
Recent military exchanges involving the United States and Iran have increased uncertainty across financial markets, pushing some investors toward traditional safe-haven assets such as gold, cash, and US Treasuries.
This geopolitical shock collided with a massive institutional exodus from the crypto market as a whole, heavily impacting major assets.
Over two weeks leading into June, more than $2 billion exited US spot Bitcoin ETFs, including massive single-day dumps from giant funds like BlackRock's IBIT.
As capital drains out of Bitcoin, it triggers a broader market contraction.
Bitcoin’s dominance has risen as investors consolidate what little crypto exposure they keep into BTC, leaving altcoins like Solana particularly exposed to severe capital flight.
Traders are also cautious around interest rate expectations, which have added further pressure.
Persistent inflation concerns have reduced expectations for aggressive Federal Reserve rate cuts, keeping Treasury yields elevated and maintaining competition for investment capital.
Higher yields often make speculative assets less attractive because investors can earn returns from lower-risk alternatives.
$SOL price analysis
On the technical side, Solana's daily chart shows a market attempting to hold a critical support level after several failed recovery attempts.
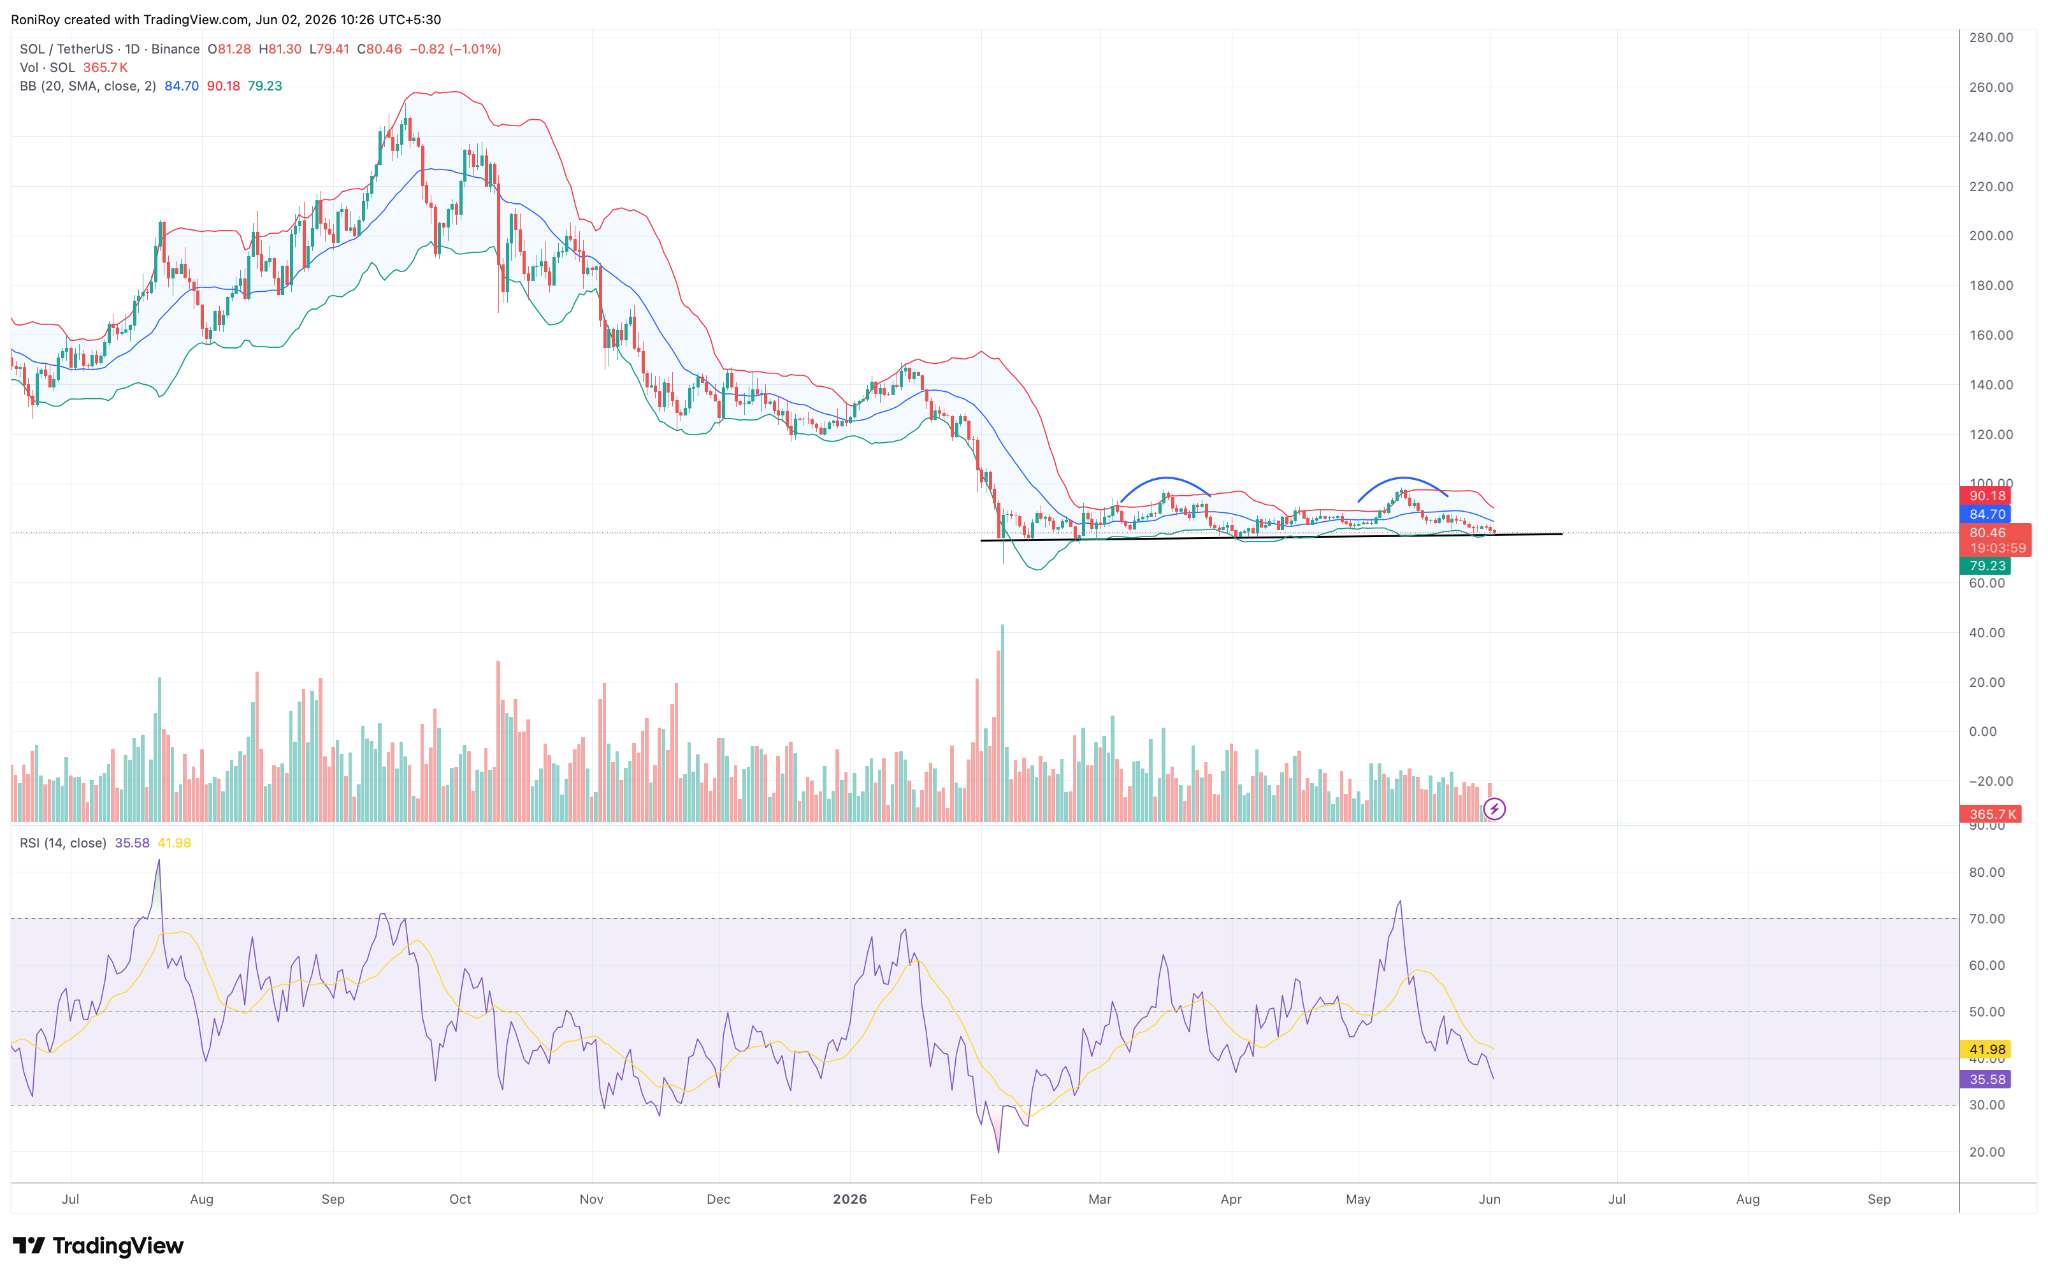
$SOL/$USDT 1-Day price chart. Source: TradingView.
Price is currently trading near the lower Bollinger Band while remaining below the indicator's midline around $84.7.
Repeated rejections beneath that area suggest buyers have been unable to regain short-term control, leaving resistance firmly established between roughly $84 and $85.
A notable feature on the chart is the appearance of two consecutive double-top formations during the recent consolidation period.
Both patterns developed after recovery attempts stalled and were followed by declines back toward support.
In technical analysis, a double top is generally viewed as a bearish reversal pattern because it signals repeated failures to push through resistance.
Momentum indicators also show weakness. The Relative Strength Index has fallen to around 35, placing it close to oversold territory while remaining below its signal line.
Although an oversold reading can sometimes precede a rebound, the indicator currently points to fading buying strength rather than renewed momentum.
Volume trends provide a similar message. Trading activity has gradually declined during the consolidation phase, indicating that buyers have not returned in sufficient numbers to support a sustained move higher.
Why $80 remains the key level
Crypto analyst Scient has identified the $79 to $80 region as the most important area on Solana's weekly chart because it aligns with the 2024 cycle low.
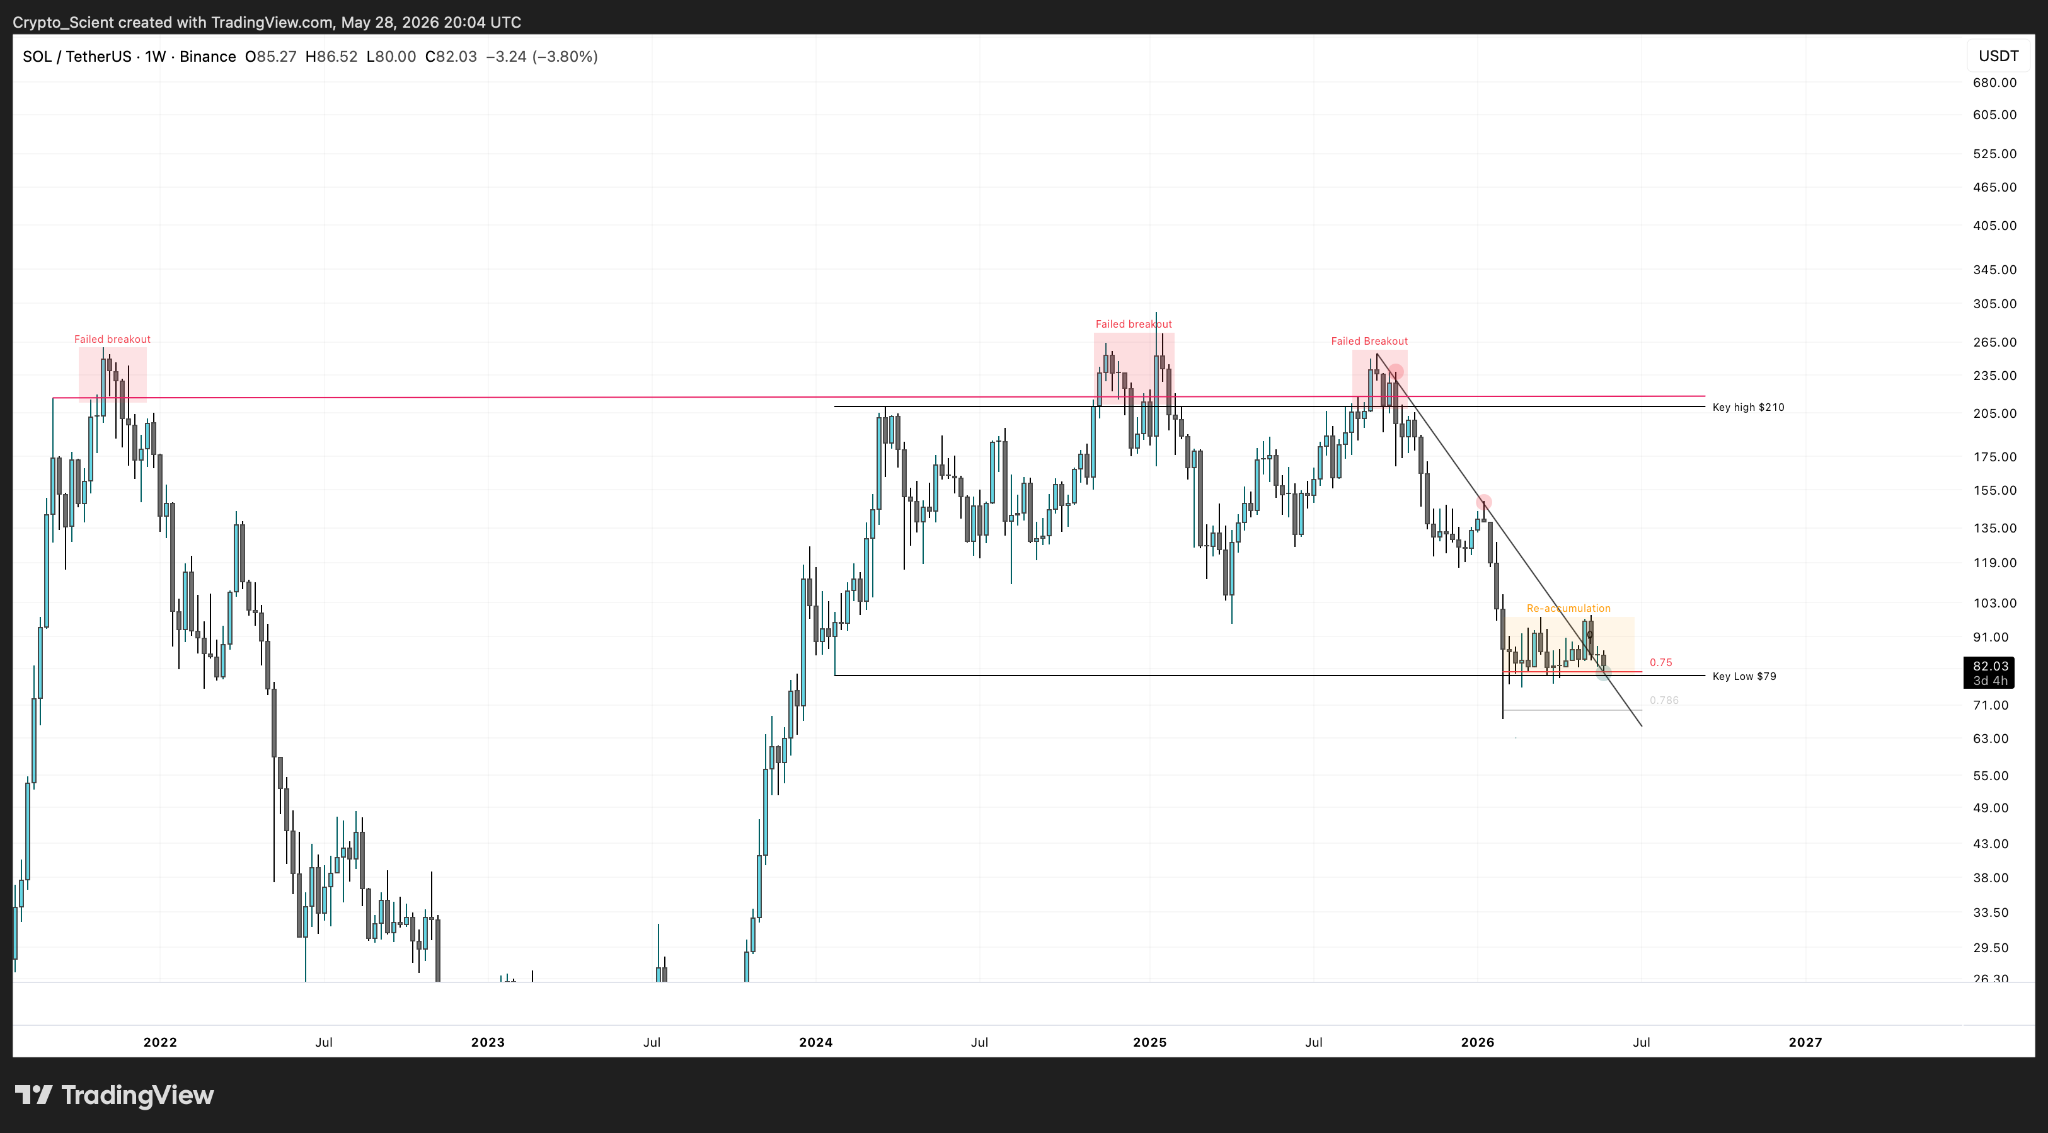
$SOL/$USDT 1-week price chart. Source: Scient on X.
“The $79-$80 is the level for $SOL. Hold it and the setup remains intact. Lose it and price likely revisits the mid $20s,” Scient said.
The analyst noted that Solana has failed to break above the $210 area on three separate occasions since 2021.
After the latest rejection near that level in late 2025, the price returned to the lower end of its multi-year trading range, where buyers have repeatedly stepped in.
Rather than viewing the current structure as a confirmed breakdown, Scient argued that the market may still be forming an accumulation range.
As long as support around $80 remains intact, the analyst believes the zone could serve as the foundation for another breakout attempt in the future.