Cryptocurrency prices rise slightly on Friday as market participants continue to assess the conflict in the Middle East. Bitcoin ($BTC) is trading above $73,000, but its upside remains capped by key supply zones. Ethereum ($ETH) mirrors the broader risk-averse sentiment, trading above $2,000 support amid persistent withdrawals from spot Exchange-Traded Funds (ETFs). Despite Ripple ($XRP) experiencing mild inflows into ETFs, the overall technical outlook remains weak, with the spot price above $1.32.
US-Iran peace deal uncertainty weighs on crypto sentiment
News that the United States (US) and Iran had reached an agreement on the Memorandum of Understanding (MOU) to extend the ceasefire by 60 days, open the Strait of Hormuz and commence nuclear talks dominated media platforms on Thursday, and was confirmed by the White House. Still, uncertainty remains as US President Donald Trump has yet to give his approval. At the same time, Tasnim news agency, Iran’s semi-official news agency, reported that the text of the MOU had not been finalized or confirmed.
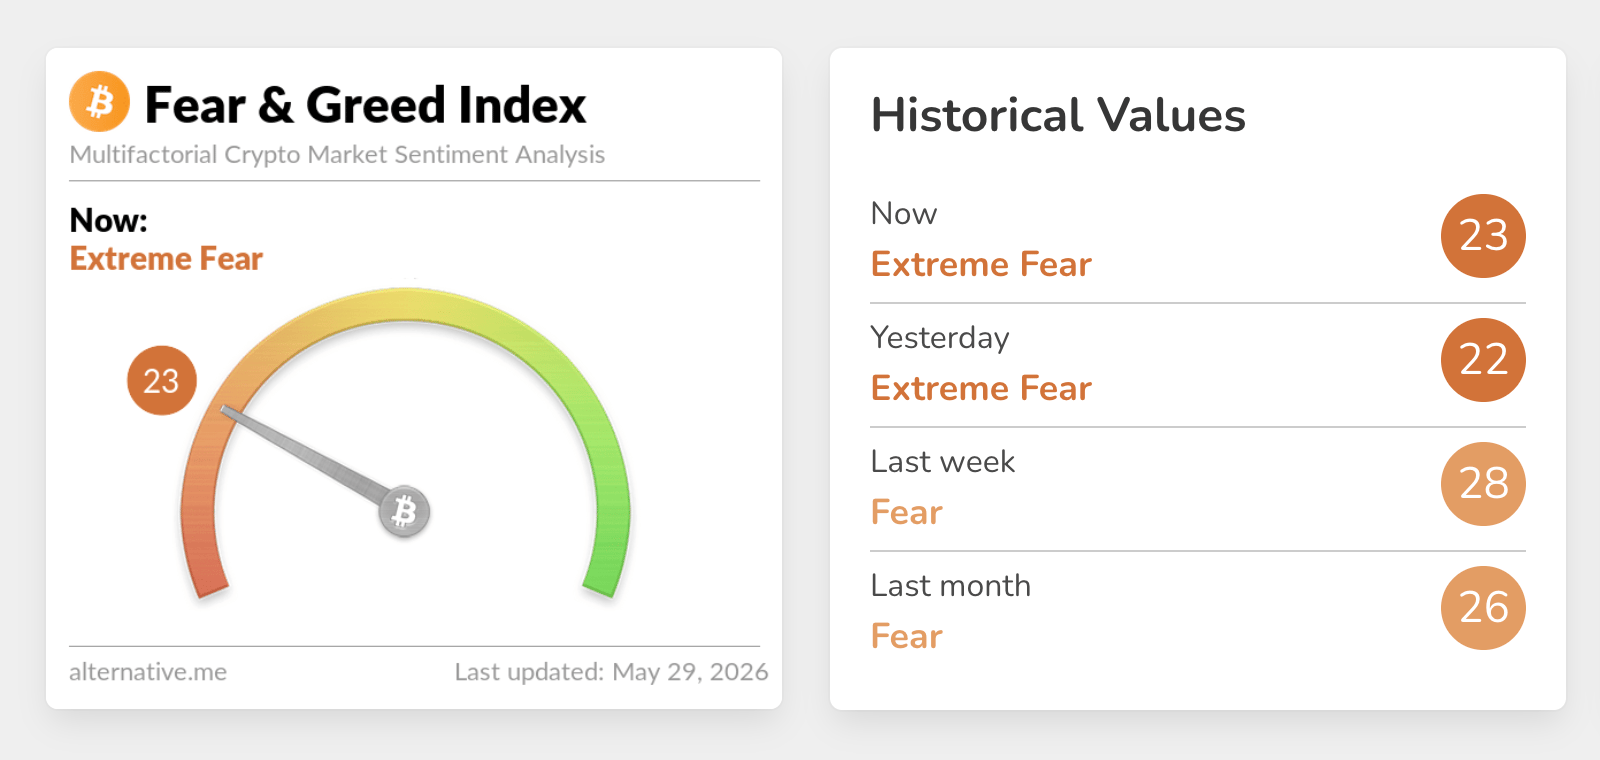
Risk appetite for crypto assets has dwindled significantly in tandem with sentiment, which, according to the Fear & Greed Index, is currently 23 in the Extreme Fear territory on Thursday, down from 28 in the Fear region last week.
Know when your coins move
Alerts, real-time prices, and market news — all in one app
4.8 based on 40K reviews in the App Store and Google Play
Crypto Fear & Greed Index | Source: Alternative
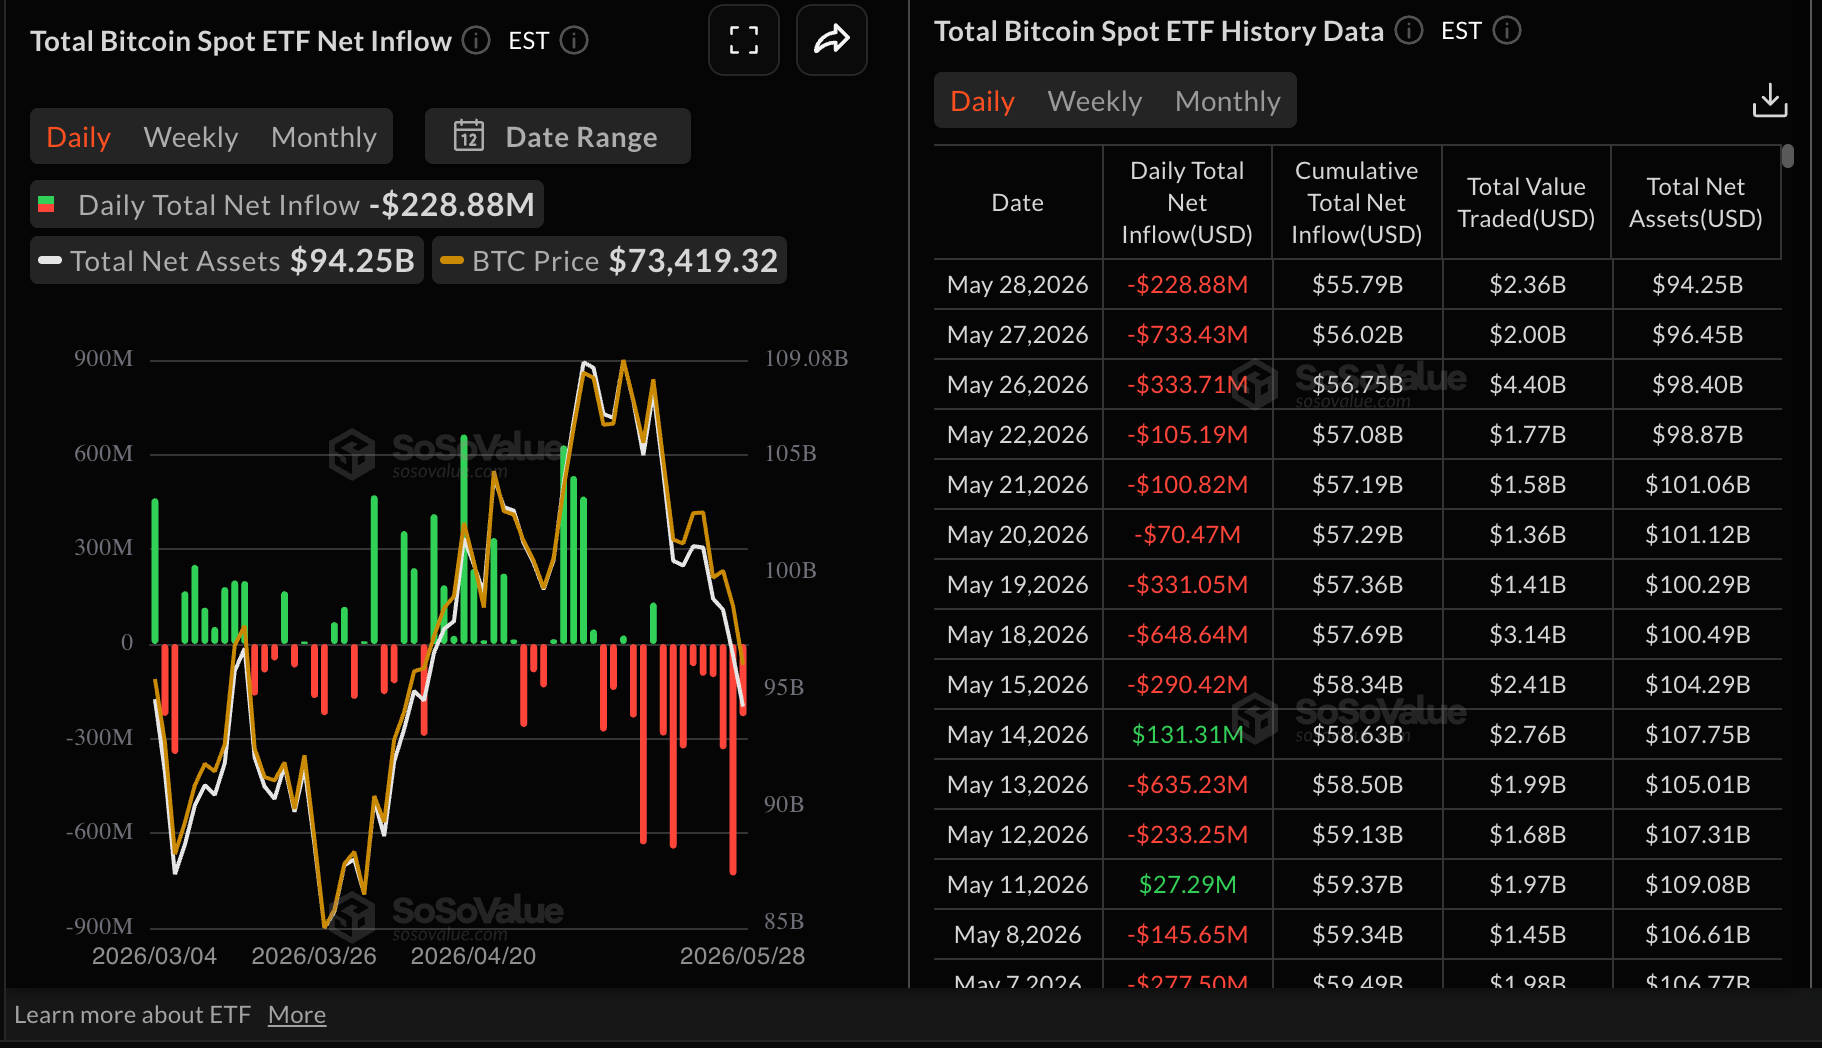
Institutions are persistently withdrawing from spot ETFs, as evidenced by the nearly $228 million in outflows recorded on Thursday. Although this was a notable step down from Wednesday's approximately $733 million, Bitcoin ETFs have sustained nine consecutive days of outflows. Still, SoSoValue data shows that $BTC ETFs have $55.79 billion in cumulative inflows while net assets under management average $94.25 billion.
Bitcoin ETF flows | Source: SoSoValue
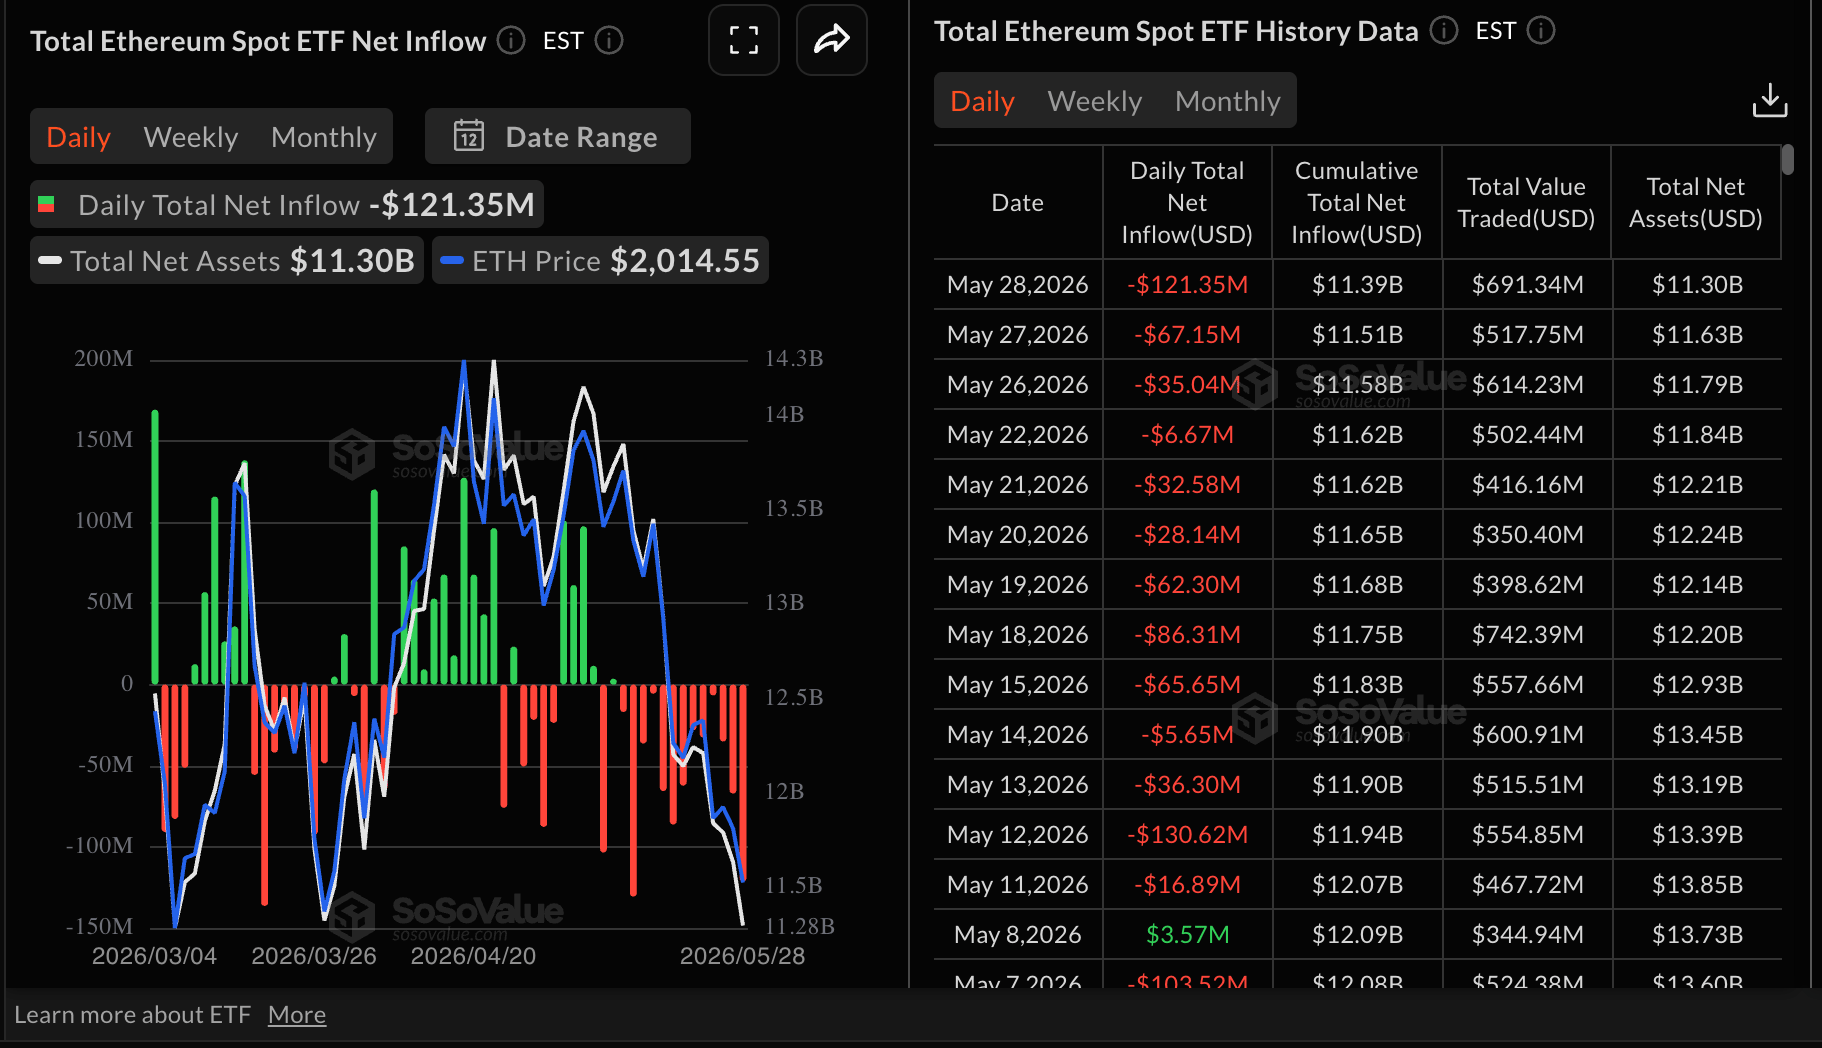
Interest in Ethereum spot ETFs remained significantly suppressed, given that outflows extended by nearly a fortnight with Thursday’s roughly $121 million. The persistent sell-off suggests that investors are continuing to assess geopolitical tensions and macroeconomic uncertainty, which rarely benefit risk assets.
Ethereum ETF flows | Source: SoSoValue
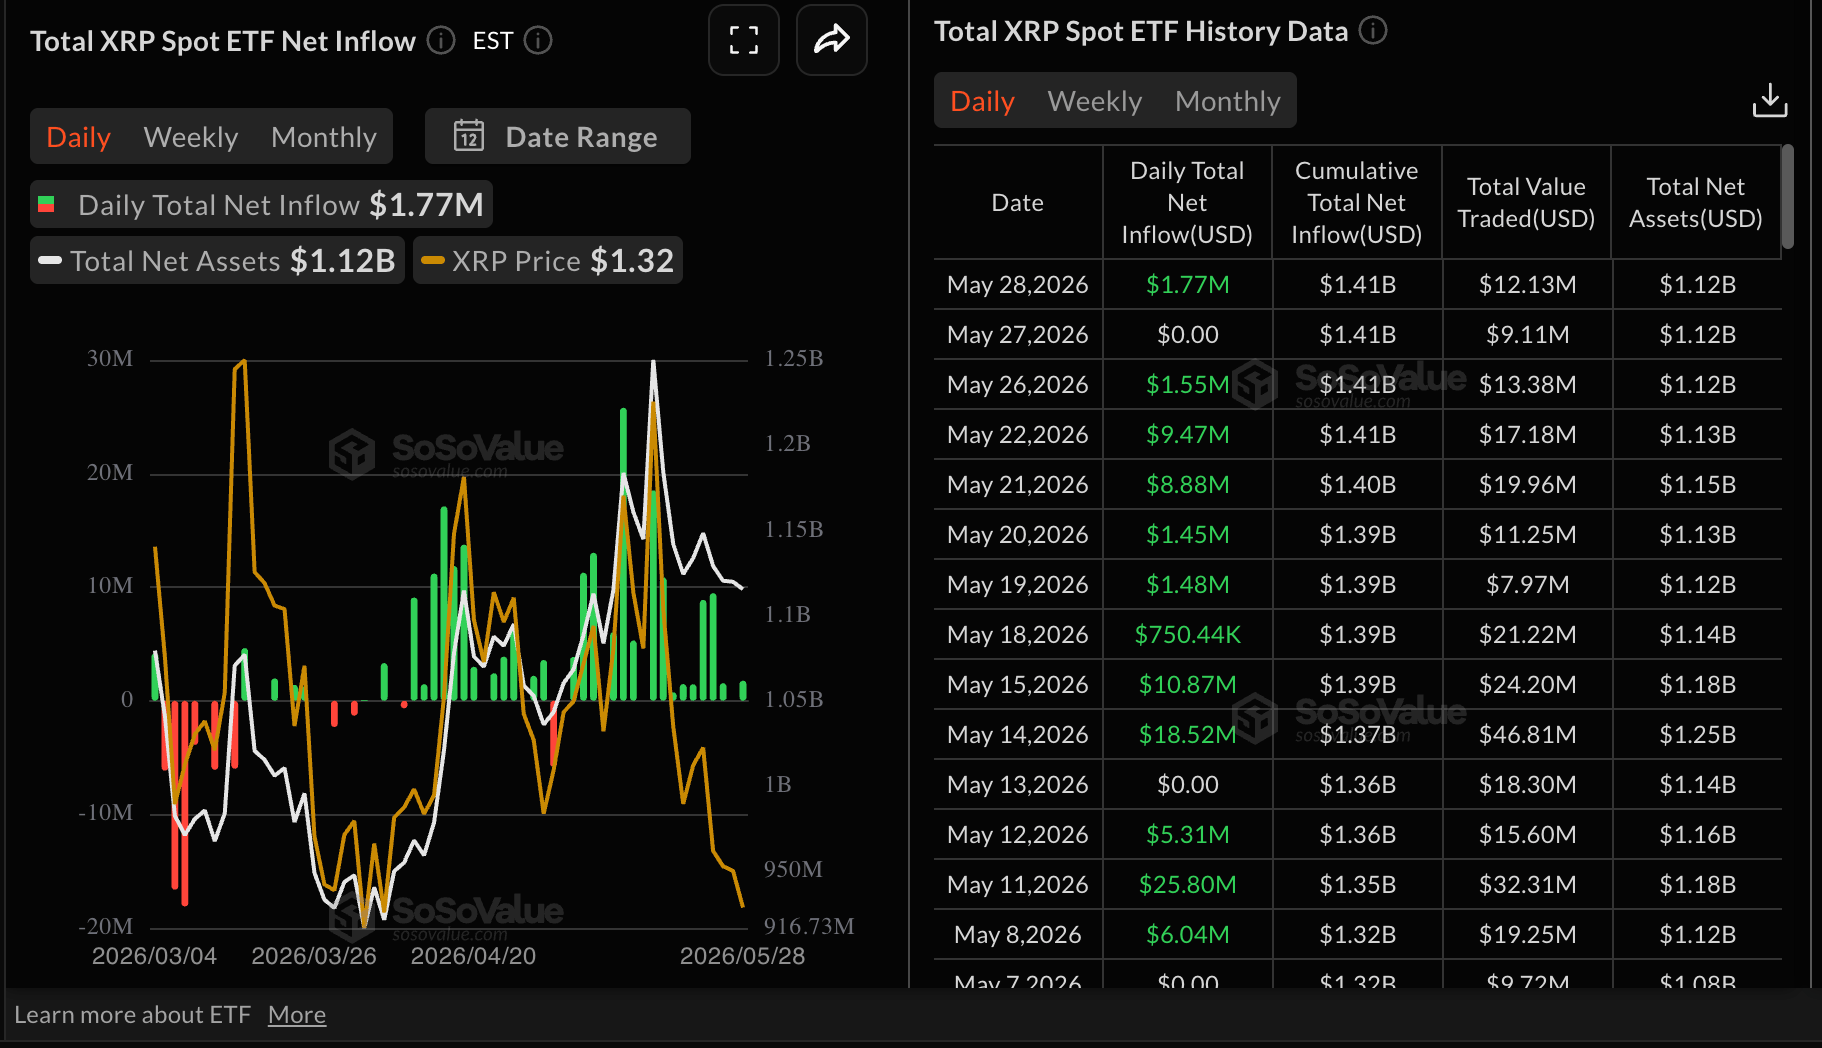
$XRP spot ETFs, on the other hand, have sustained a relatively steady bullish streak with mild inflows of $1.77 million on Thursday. It is worth mentioning that activity remained muted on Wednesday. Before that, the ETFs had upheld a steady, mild but bullish streak since May 14. Cumulative inflows now stand at $1.41 billion with net assets under management at $1.12 billion. That said, the suppressed inflows could be supportive of $XRP’s short-term outlook. However, the broader crypto outlook remains lethargic and with structural weakness capping the tone, $XRP may experience a slow recovery.
$XRP ETF flows | Source: SoSoValue
Price Analysis: Bitcoin tests recovery potential
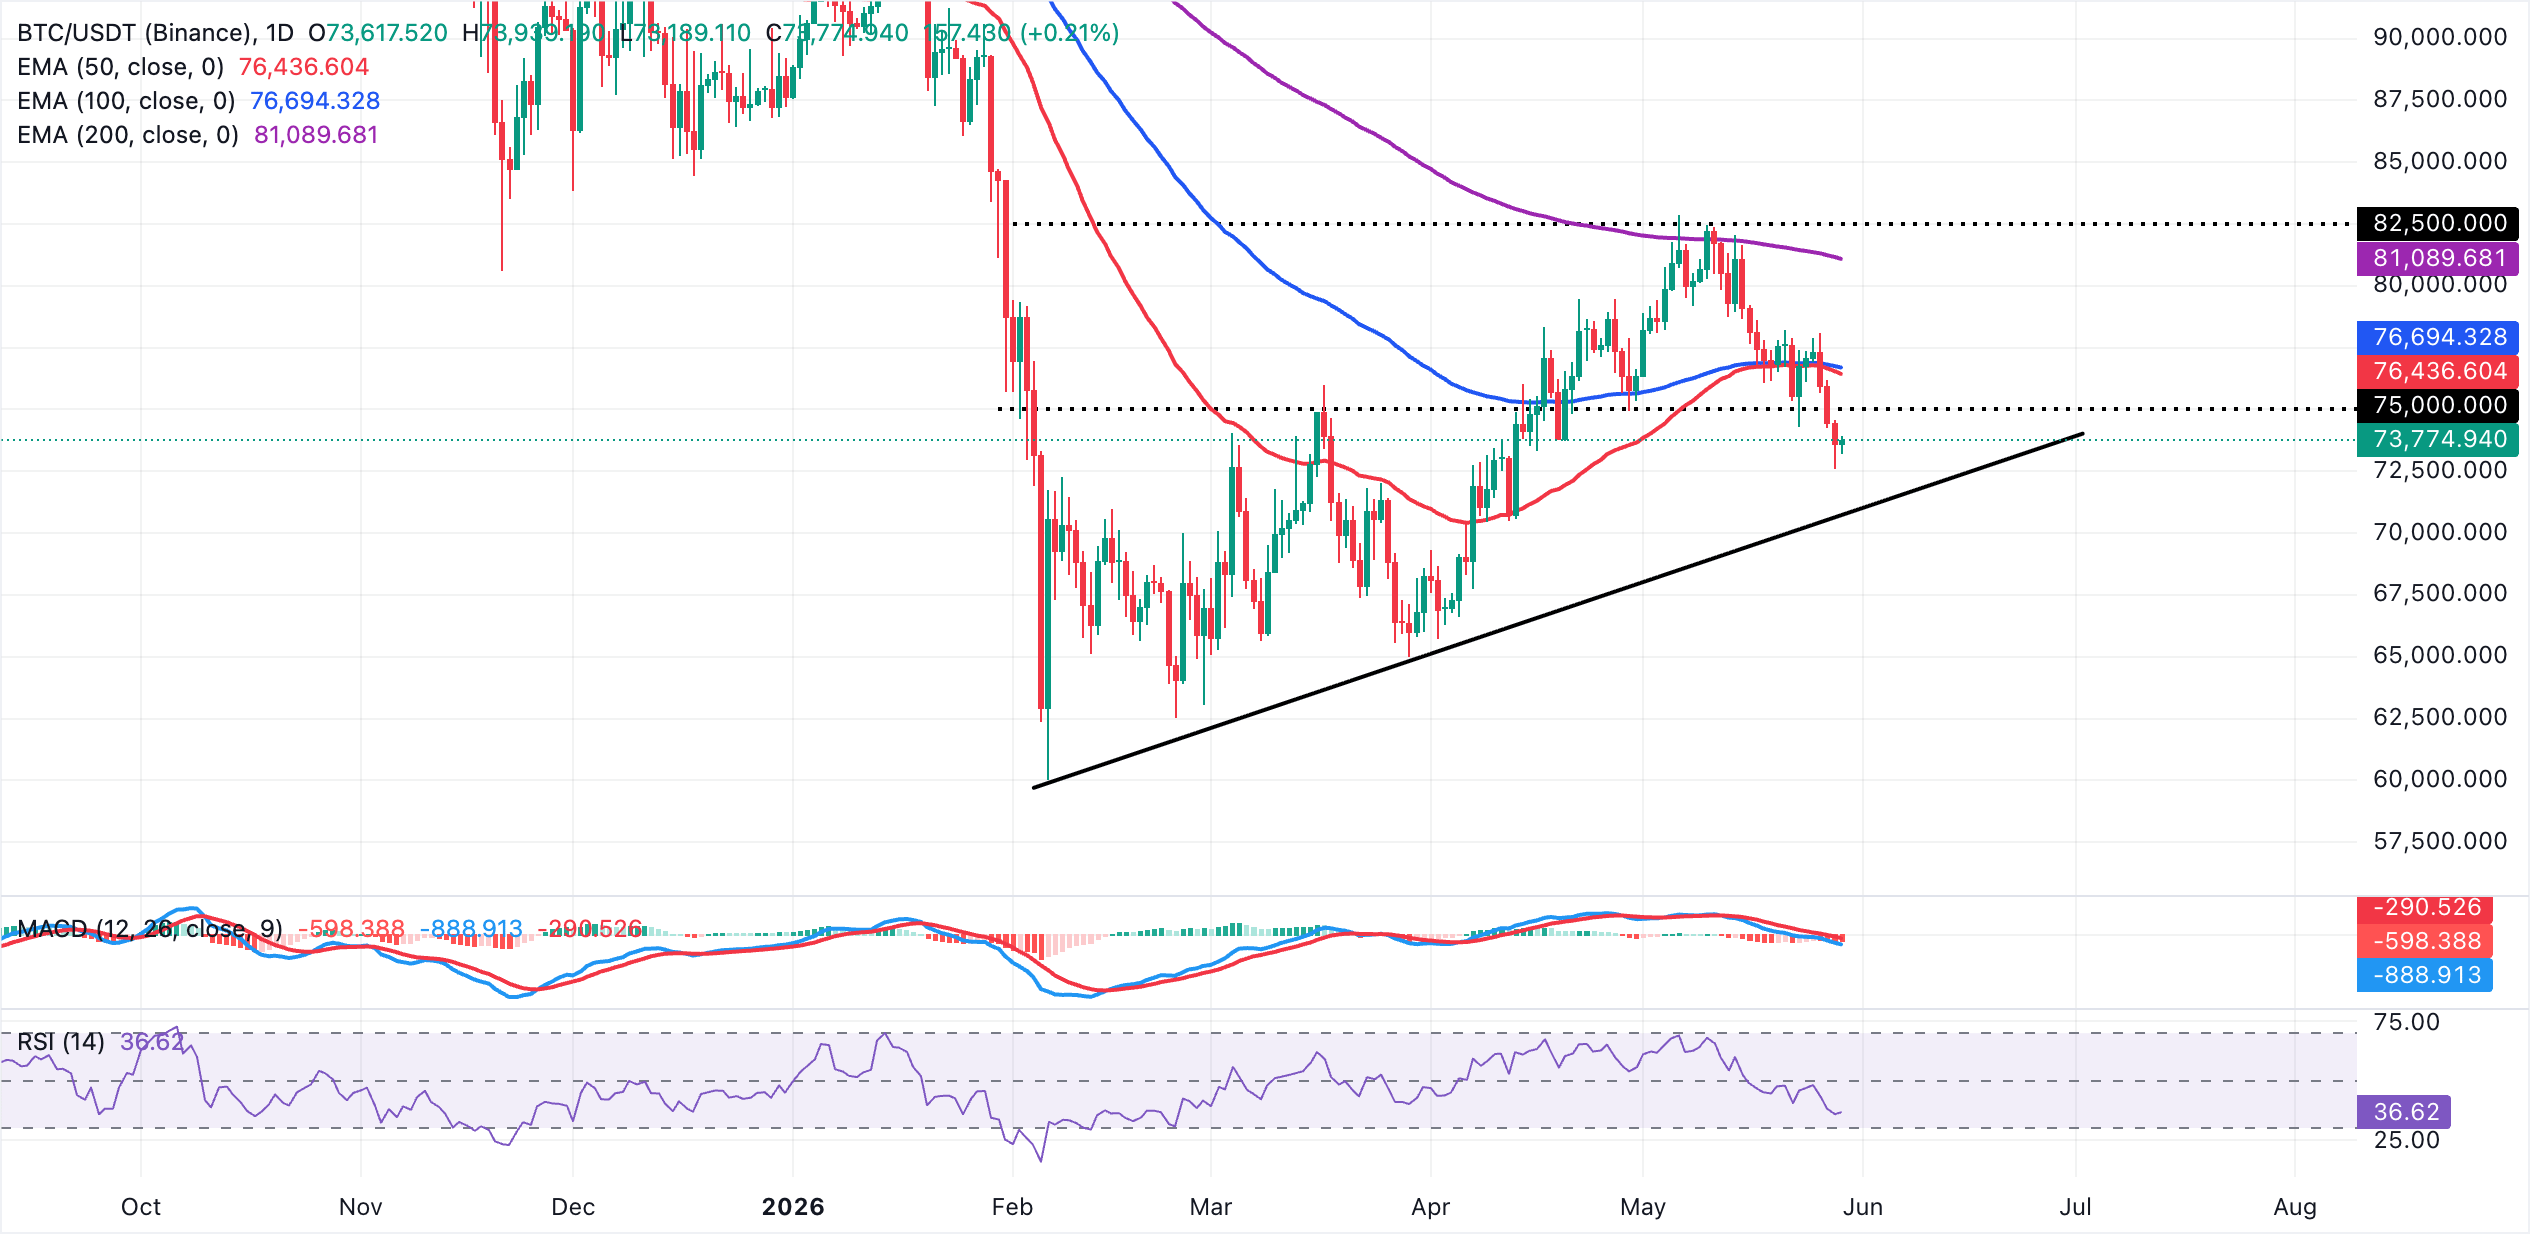
Bitcoin trades at $73,774, keeping a bearish near-term bias as price holds below the 50-day, 100-day and 200-day Exponential Moving Averages (EMAs). This configuration suggests rallies are being sold into, while a subdued Relative Strength Index (RSI) near 37 on the daily chart and a negative Moving Average Convergence Divergence (MACD) histogram below the zero mark reinforce persistent downside pressure rather than an impulsive recovery.
$BTC/$USDT daily chart
On the topside, initial resistance is lies around the 50-day EMA near $76,436, followed by the 100-day EMA at roughly $76,694, with the 200-day EMA higher up near $81,090 acting as a more strategic cap if buyers attempt a deeper squeeze. On the downside, the key structural support sits near on the ascending trendline area around $70,766. A daily close below this zone would likely open the door to a more pronounced corrective leg, while holding above it would merely keep $BTC confined within a corrective bounce under heavy moving-average resistance.
Altcoins technical outlook: Ethereum and $XRP struggle to sustain rebound
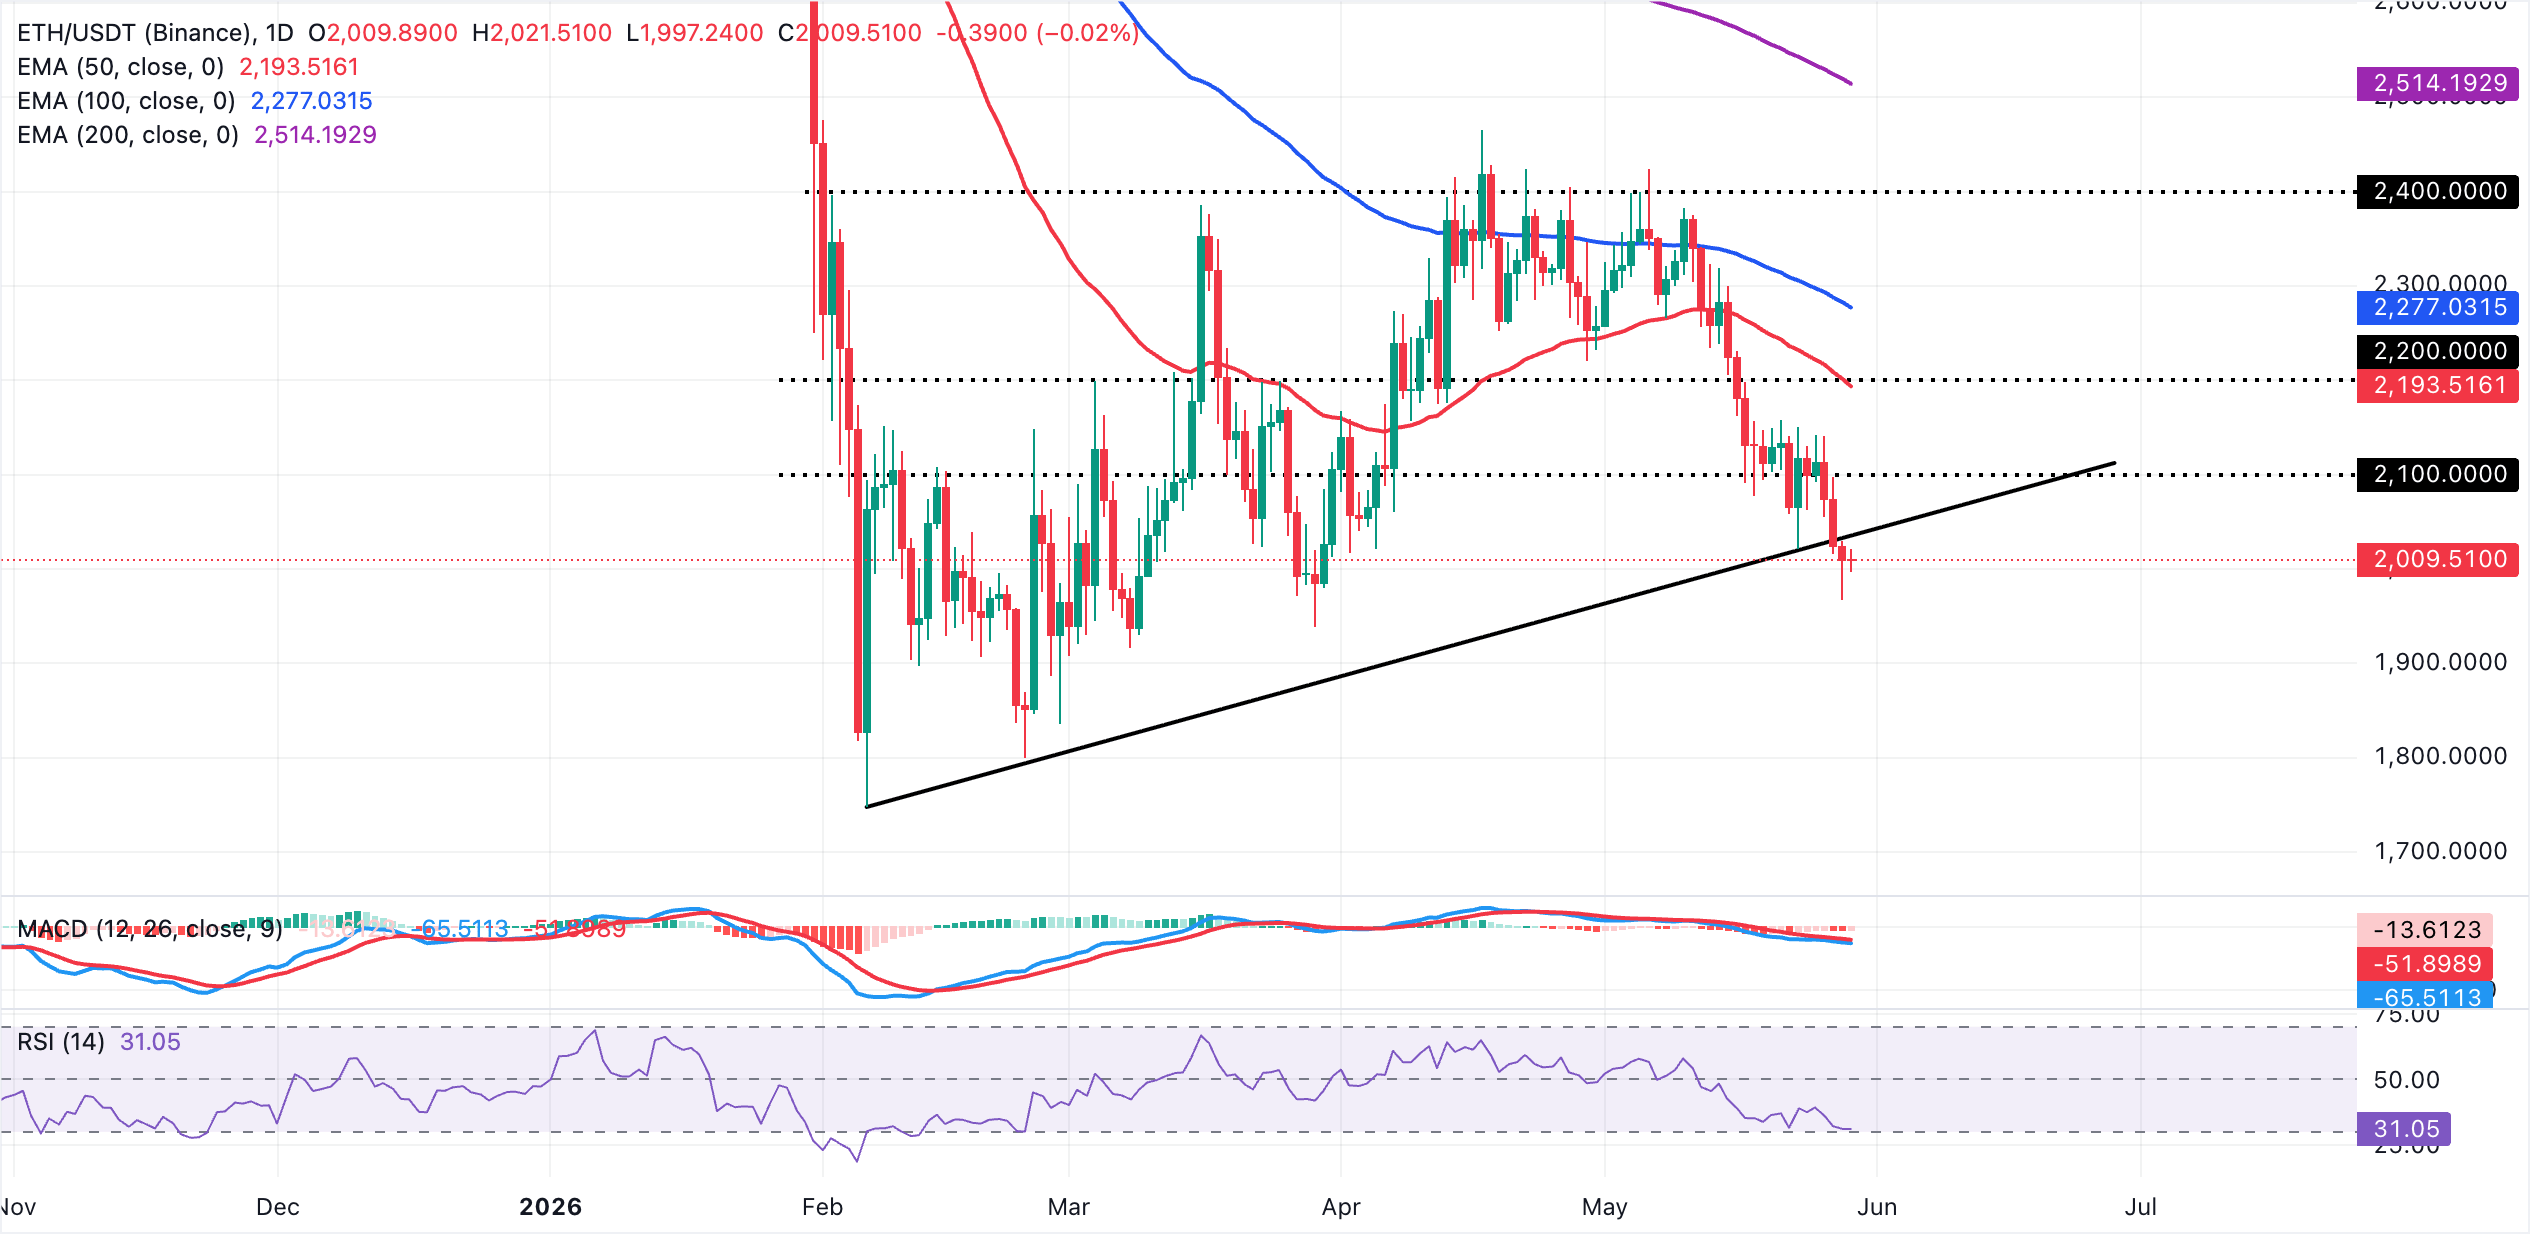
Ethereum trades near $2,010, keeping a bearish near-term bias as price holds well below the key moving averages. The 50-day EMA at $2,194, the 100-day EMA at $2,277 and the 200-day EMA at $2,514 all sit overhead, suggesting rallies are likely to face supply, while the broken rising trendline aligns with resistance around $2,036.
Momentum conditions reinforce the downside tone, with the RSI hovering near oversold territory around 31 on the daily chart and the MACD histogram remaining negative below the zero line.
$ETH/$USDT daily chart
On the topside, initial resistance emerges at the former rising support line near $2,036, where a daily close back above would be needed to ease immediate selling pressure. Beyond that, the 50-day EMA at $2,193 and the 100-day EMA at $2,277 create a layered cap ahead of the more significant 200-day EMA near $2,514, which defines the broader bearish line in the sand for $ETH/$USDT.
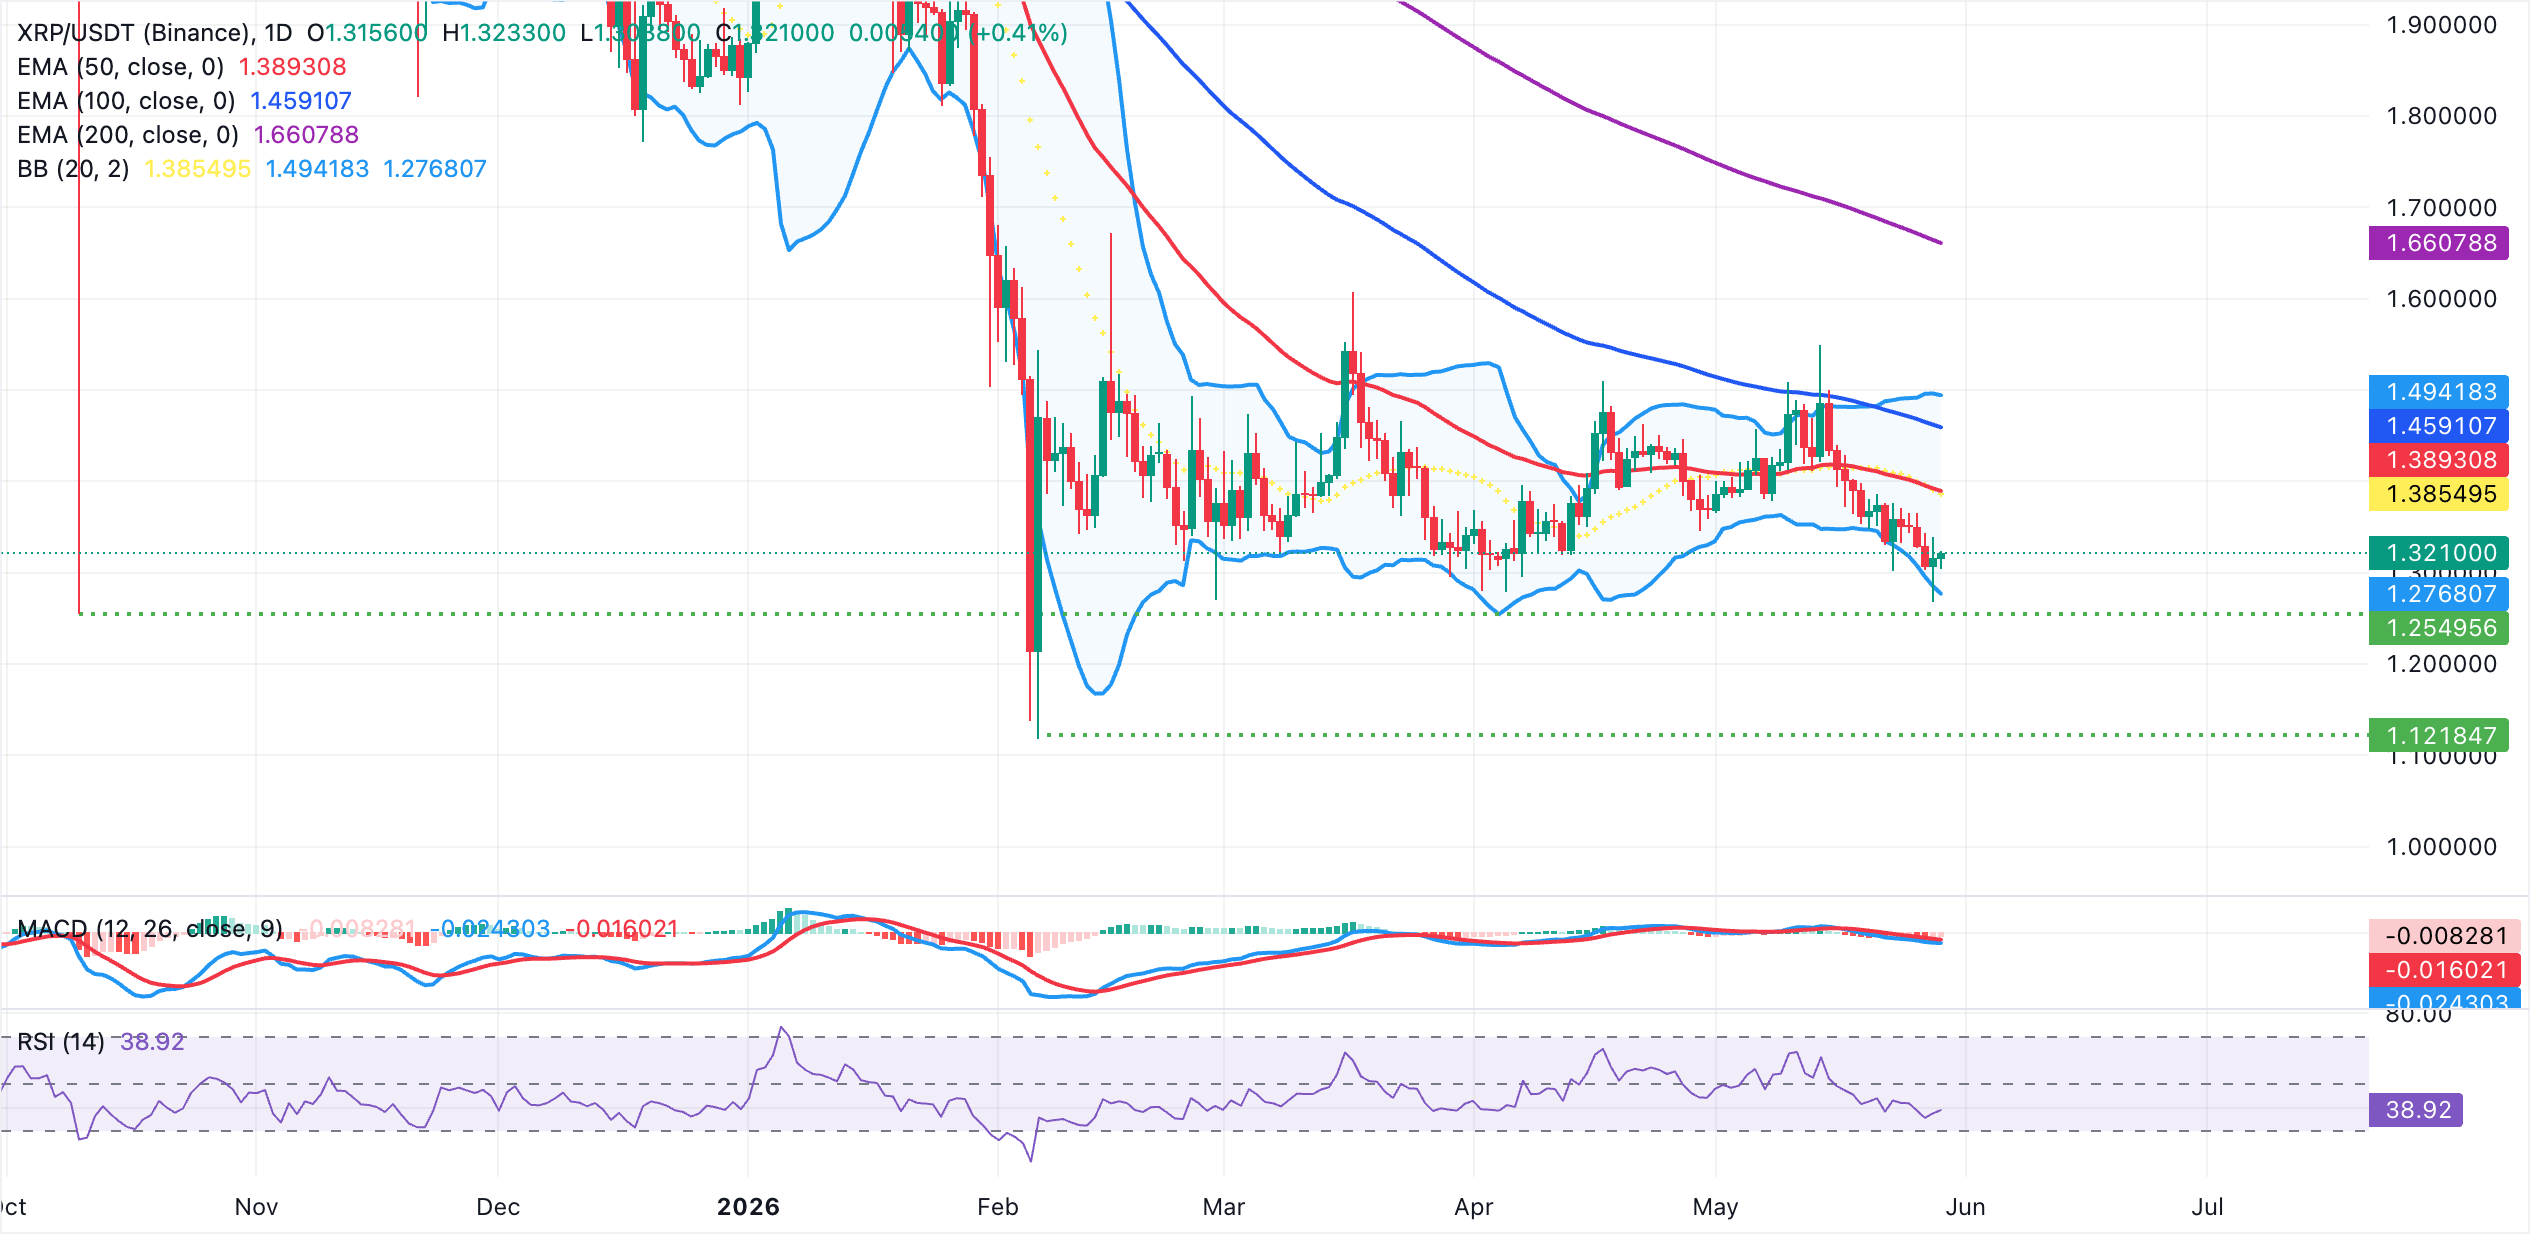
$XRP, on the other hand, trades at $1.32. The pair remains in a bearish near-term bias, holding below the Bollinger midline around $1.39 and key moving averages. The 50-day EMA near $1.39, the 100-day EMA around $1.46 and the 200-day EMA closer to $1.66 signal persistent overhead supply.
Momentum conditions reinforce this capped tone, as the RSI sits just below 40 on the daily chart while the MACD histogram remains in negative territory, suggesting downside pressure is still present despite some recent stabilization.
$XRP/$USDT daily chart
On the topside, initial resistance is clustered around the Bollinger middle band at $1.39, reinforced by the 50-day EMA at roughly the same range. A daily close above this zone would be needed to ease immediate selling pressure and expose the 100-day EMA near $1.46, ahead of the Bollinger upper band around $1.49 and the more distant 200-day EMA at $1.66.
The first notable support emerges at the Bollinger lower band near $1.28, where buyers may attempt to absorb the supply and stop the decline. Still, a break below this floor would open the door to a deeper retracement within the broader corrective phase.
(The technical analysis of this story was written with the help of an AI tool.)

 fxstreet.com