Dogecoin Cycle Chart. Source: Cryptollica on X
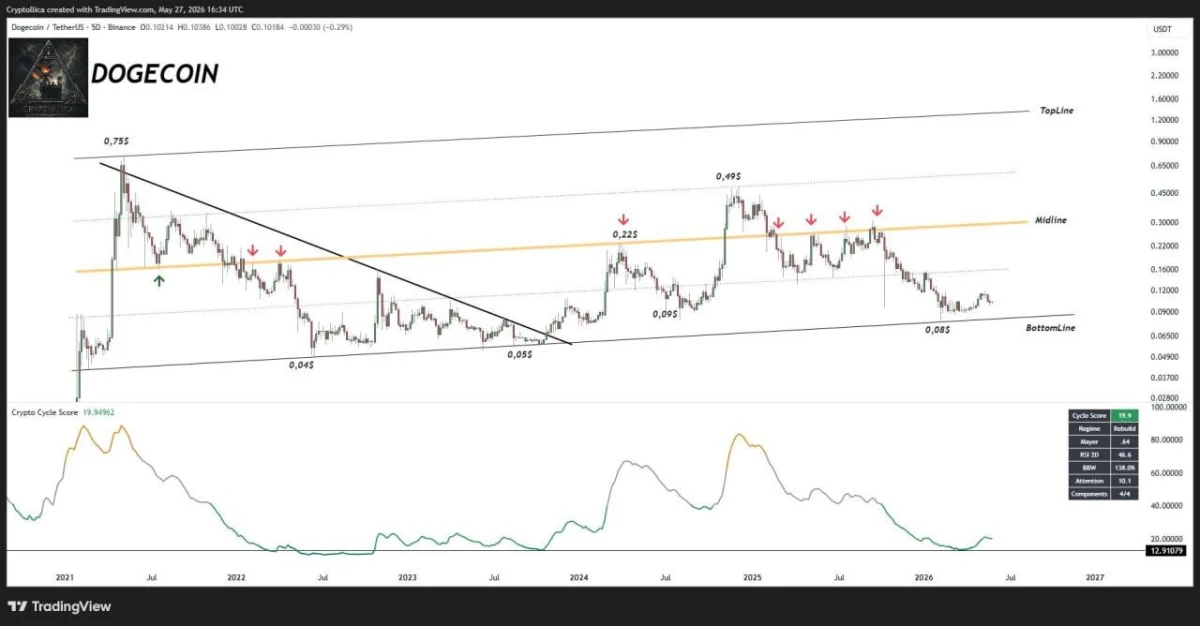
The chart shows $DOGE moving inside a wide rising channel from 2021 to 2027. The structure includes a top line, midline, and bottom line, with price now sitting closer to the lower channel area.
In past cycles, Dogecoin formed major lows near the bottom of the channel before moving into stronger upside phases. The chart marks earlier bottom zones near $0.04, $0.05, $0.09, and $0.08.
The chart also shows several major peaks, including the 2021 high near $0.75, a 2024 move near $0.22, and a later high near $0.49. Each peak followed a rebuild phase near lower support.
Cryptollica said the current setup reflects a conflict between weak sentiment and a rebuilding chart structure. The chart’s cycle table shows a Cycle Score of 19.9, with the regime marked as Rebuild.
That score supports the analyst’s view that $DOGE is still in a rebuilding phase rather than a confirmed breakout. The chart also shows RSI 2D at 46.6 and Attention at 10.1, suggesting the setup has not moved into a crowded momentum phase yet.
However, $DOGE still needs confirmation. A hold near the lower channel would keep the long-term cycle structure intact, while a move back toward the midline would show stronger recovery pressure.
A break below the bottom line would weaken the setup and challenge the repeated cycle pattern shown on the chart.
Dogecoin Price Holds Long Term Support as Analyst Eyes Return to Upper Channel
Dogecoin is holding near a long term rising support line as analyst Roel Balboa says $DOGE could eventually move back into its higher channel.
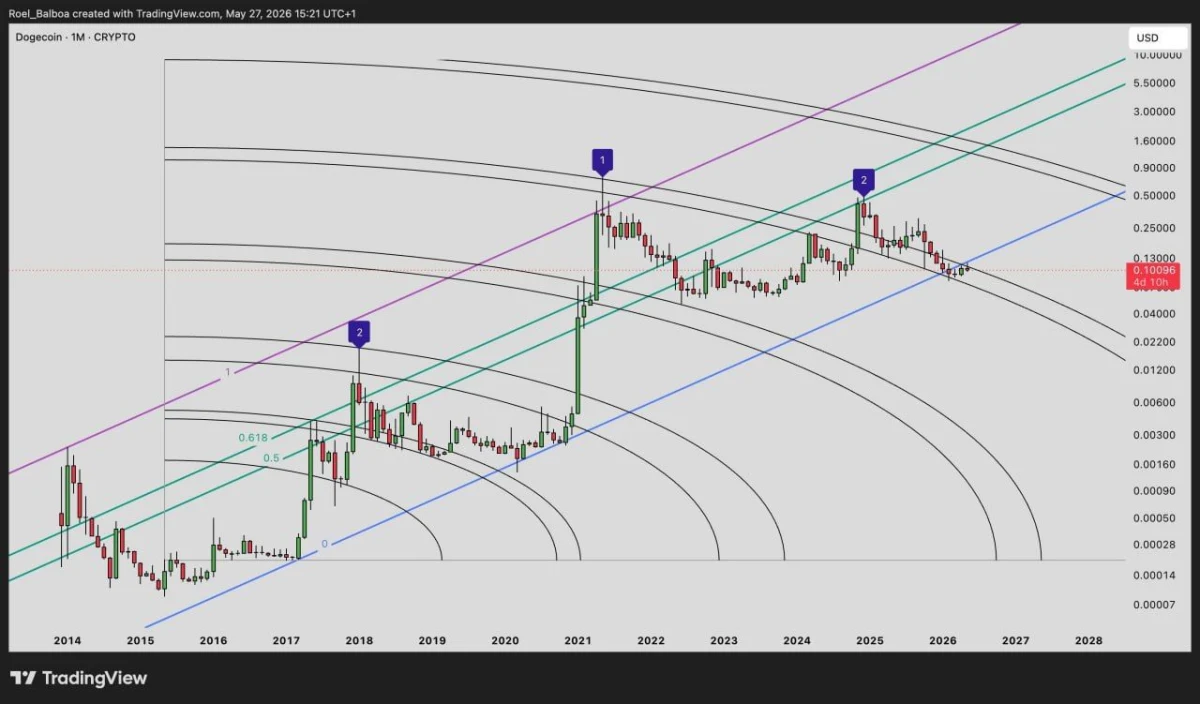
The monthly chart shared on X shows $DOGE trading near the blue support line after pulling back from its 2024 to 2025 high area. The analyst said he does not know when the move will happen, but he expects $DOGE to return to the upper channel.
Dogecoin Monthly Chart. Source: Roel Balboa on X
The chart tracks Dogecoin from 2014 through 2028 and shows several long term channels. $DOGE previously moved sharply higher after touching or holding key rising support zones.
The blue rising line now acts as the main support area. $DOGE is sitting close to that line, which makes the current zone important for the wider structure.
Above price, the chart shows a green channel that marked earlier upside movement. Roel Balboa pointed to that area as the zone $DOGE could return to if buyers defend the current support and rebuild momentum.
The chart also includes several curved black resistance and support bands. These bands show how $DOGE has moved through long cycle phases, with strong rallies often appearing after long sideways or downward periods.
However, $DOGE still needs confirmation. A move back above the nearby curved resistance line would be the first sign that buyers are regaining control.
If $DOGE loses the blue support line, the channel return setup would weaken. Until then, the chart shows Dogecoin holding a long term level that has shaped past cycle moves.

 coinpaper.com