Here’s why the XRP price is in a deep dive today (May 28)
invezz.com
28 May 2026 10:21, UTC
$XRP price crashed below a crucial support level today, May 28, as liquidations in the crypto industry. It also plunged amid the ongoing US-Iran tensions, and as investors rotated to the fast-growing space and artificial intelligence industries. Ripple dropped to $1.2723, its lowest level since February.
$XRP price crashes as ETF inflows stall
Ripple's price retreated sharply, mirroring developments in the broader crypto industry. Bitcoin, the biggest coin, dropped below $73,000, while the valuation of all tokens plunged by over 3%.
Data shows that demand for $XRP ETFs has slowed. These funds had no inflows or outflows on Wednesday. That is better than Bitcoin, which suffered a $700 million outflow on the same day.
Know when your coins move
Alerts, real-time prices, and market news — all in one app
Point your phone camera to install
4.8 based on 40K reviews in the App Store and Google Play
Still, on the positive side, these funds are having their best month so far this year as they added over $118 million in assets. Before that, their best month was in November last year when they added $666 million in assets.
US-Iran tensions are rising
$XRP token price is falling today as tensions between the US and Iran continue. The US launched some attacks against Iranian targets overnight. This happened two days after the military launched similar attacks. Iran, which is keen to have a deal with the US, retaliated by shooting down a US drone.
Analysts warn that its patience will end and push it to respond in a more aggressive manner. Such a move will lead to more fighting, driving crude oil prices higher in the near term.
These events are happening as the US and Iran continue their negotiations. In a statement last week, President Donald Trump said that a deal between the two was largely negotiated.
Still, there are chances that the two sides will not launch a 60-day ceasefire as Trump is under political pressure from his allies. Senators Ted Cruz, Lindsey Graham, and Roger Wicker have pushed Trump to “finish the job.” A return to war would push energy prices higher and boost the possibility that the Federal Reserve will hike interest rates.
On the positive side, $XRP price has some highly bullish catalysts. For example, Ripple USD ($RLUSD) stablecoin has attracted over $1.8 billion in assets, making it the third-largest regulated coin after USDC and PYUSD.
Data shows that $RLUSD holders have continued to use their tokens. Artemis data show that $697 million of these tokens is in the $XRP Ledger, while the rest is in Ethereum. Also, the 30-day adjusted transaction volume jumped to over $11.8 billion.
$XRP price technical analysis
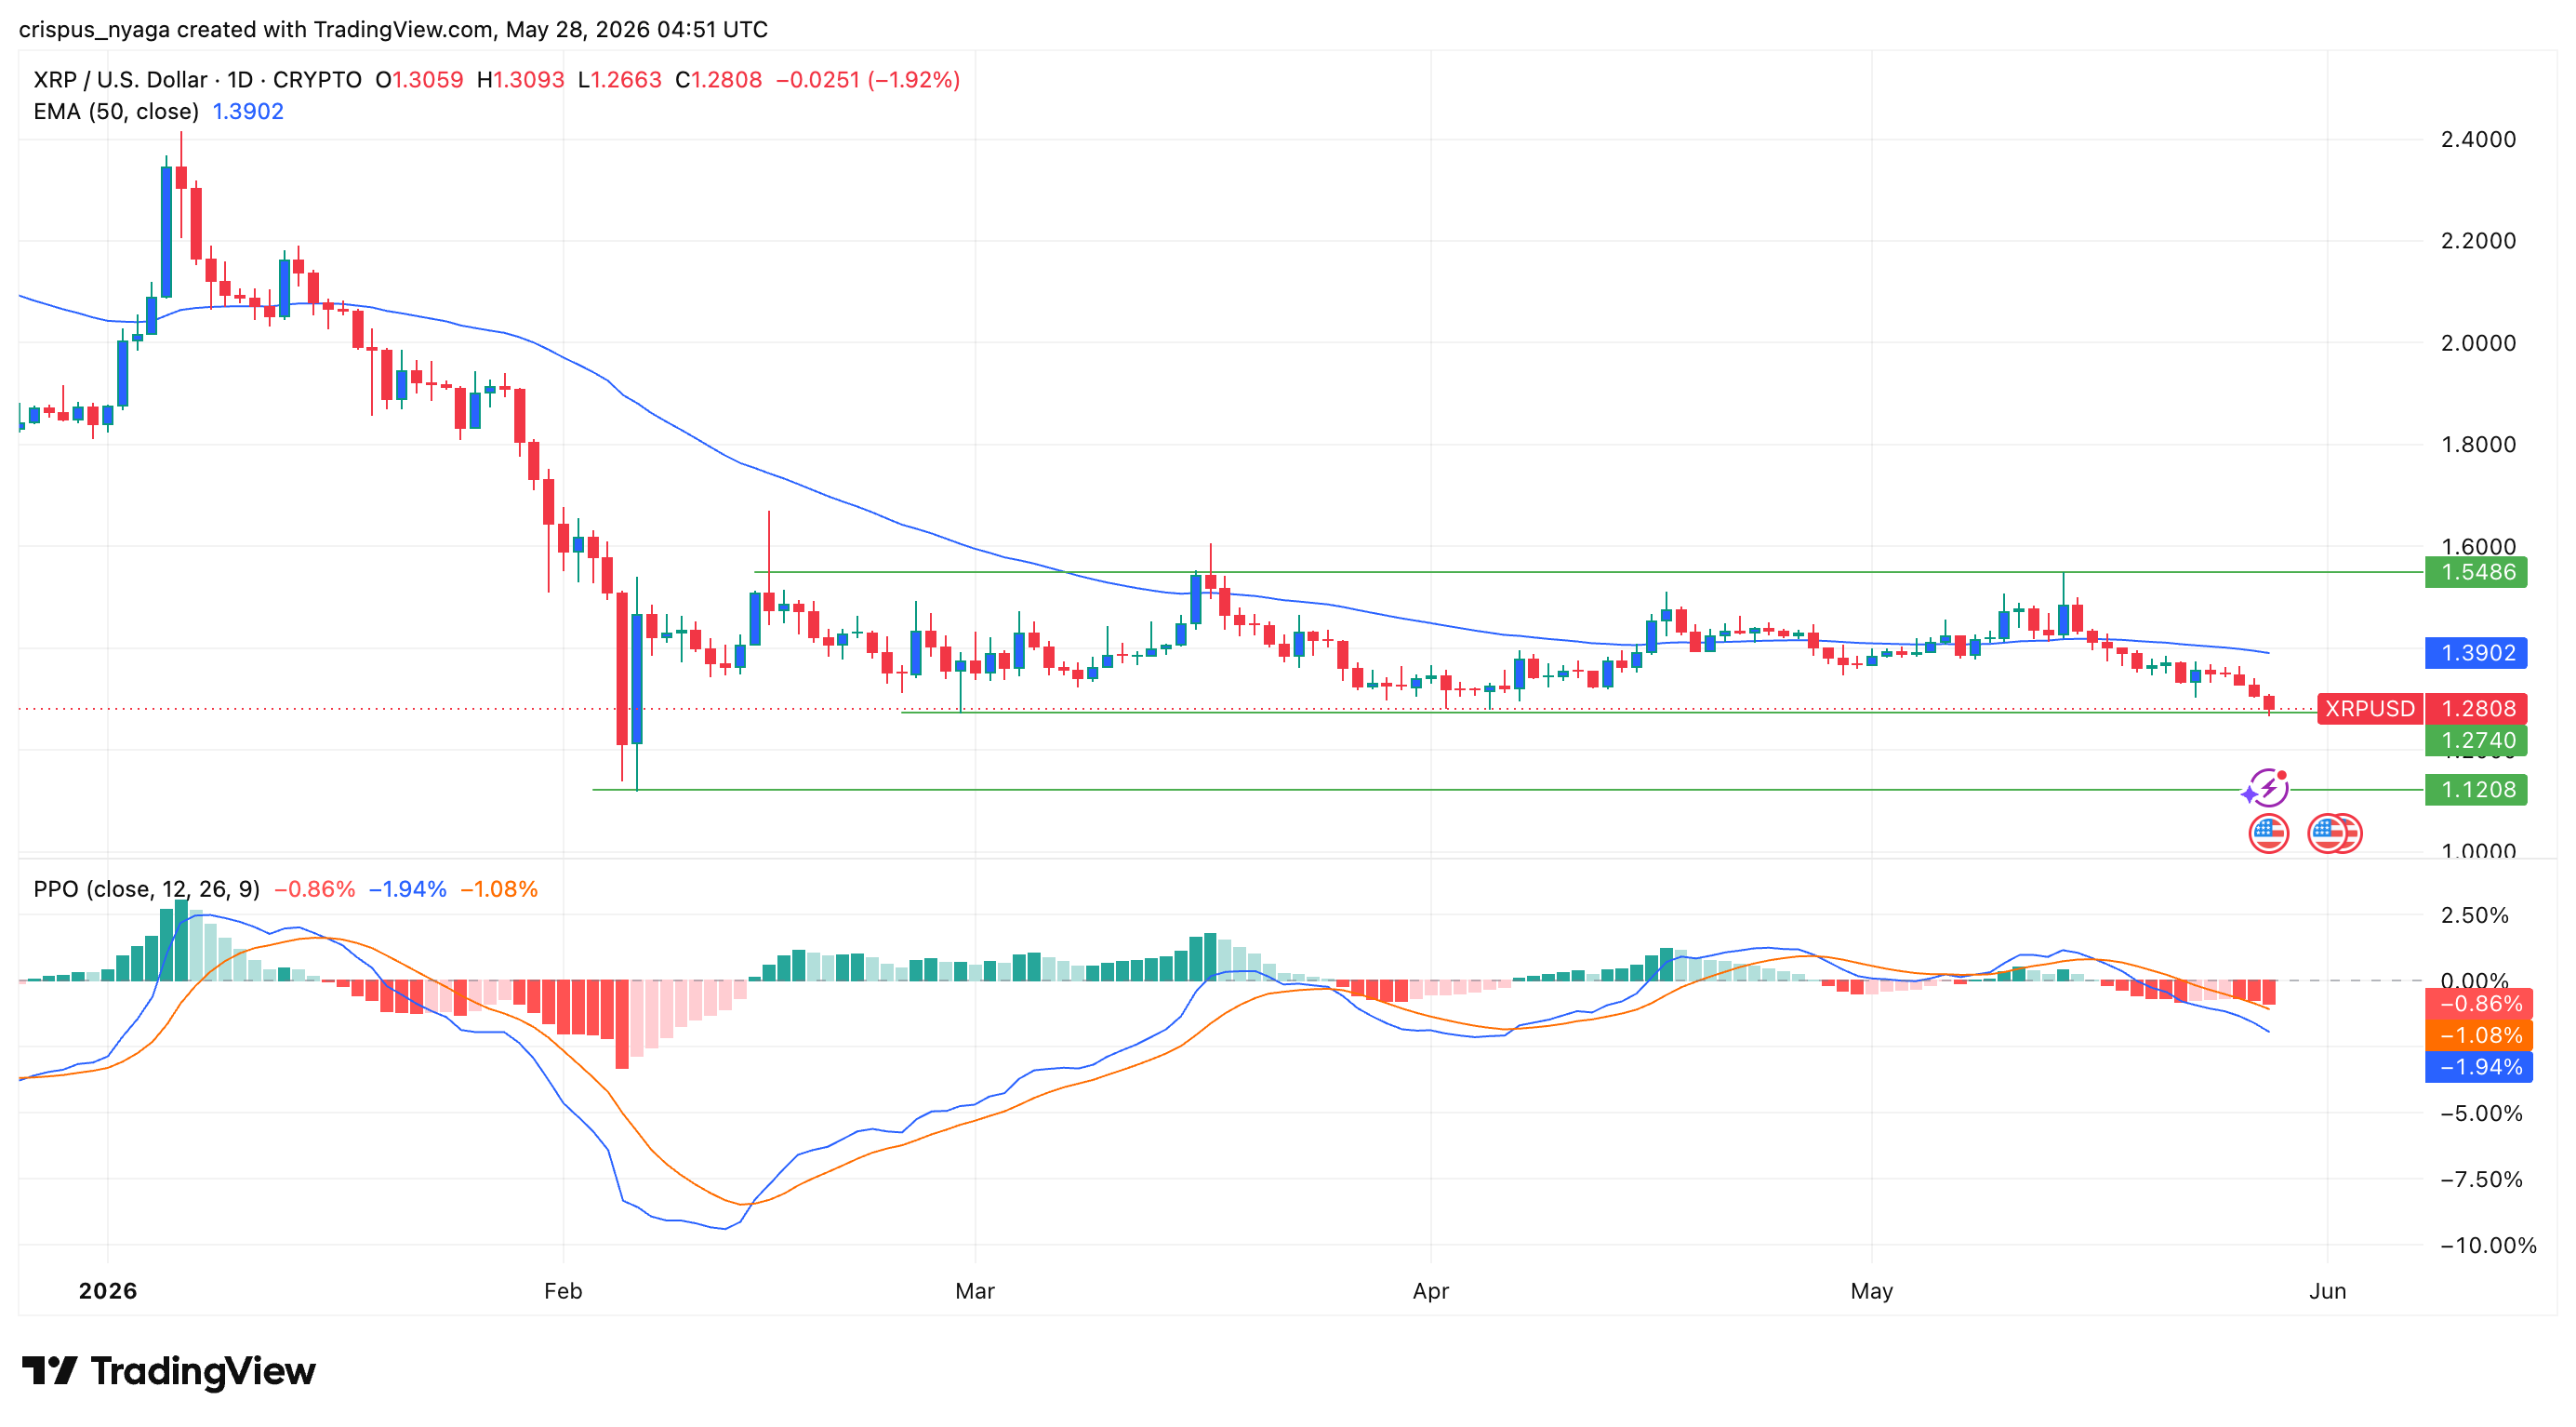
Ripple price chart | Source: TradingView
The daily chart shows that the Ripple price has slumped in the past few days, moving from a high of $1.5485 on May 14 to the current $1.2800. It has moved below the key support level at $1.2810, its lowest level in February and April this year.
The coin has slumped below all moving averages, a sign that bears remain in control. Also, the Relative Strength Index (RSI) and the MACD have continued pointing downwards.
Therefore, there is a likelihood that the $XRP price will continue falling, potentially to the key support level at $1.1200, its lowest point in February this year. On the other hand, a move above the key resistance level at $1.3600 will invalidate the bearish outlook.

 invezz.com