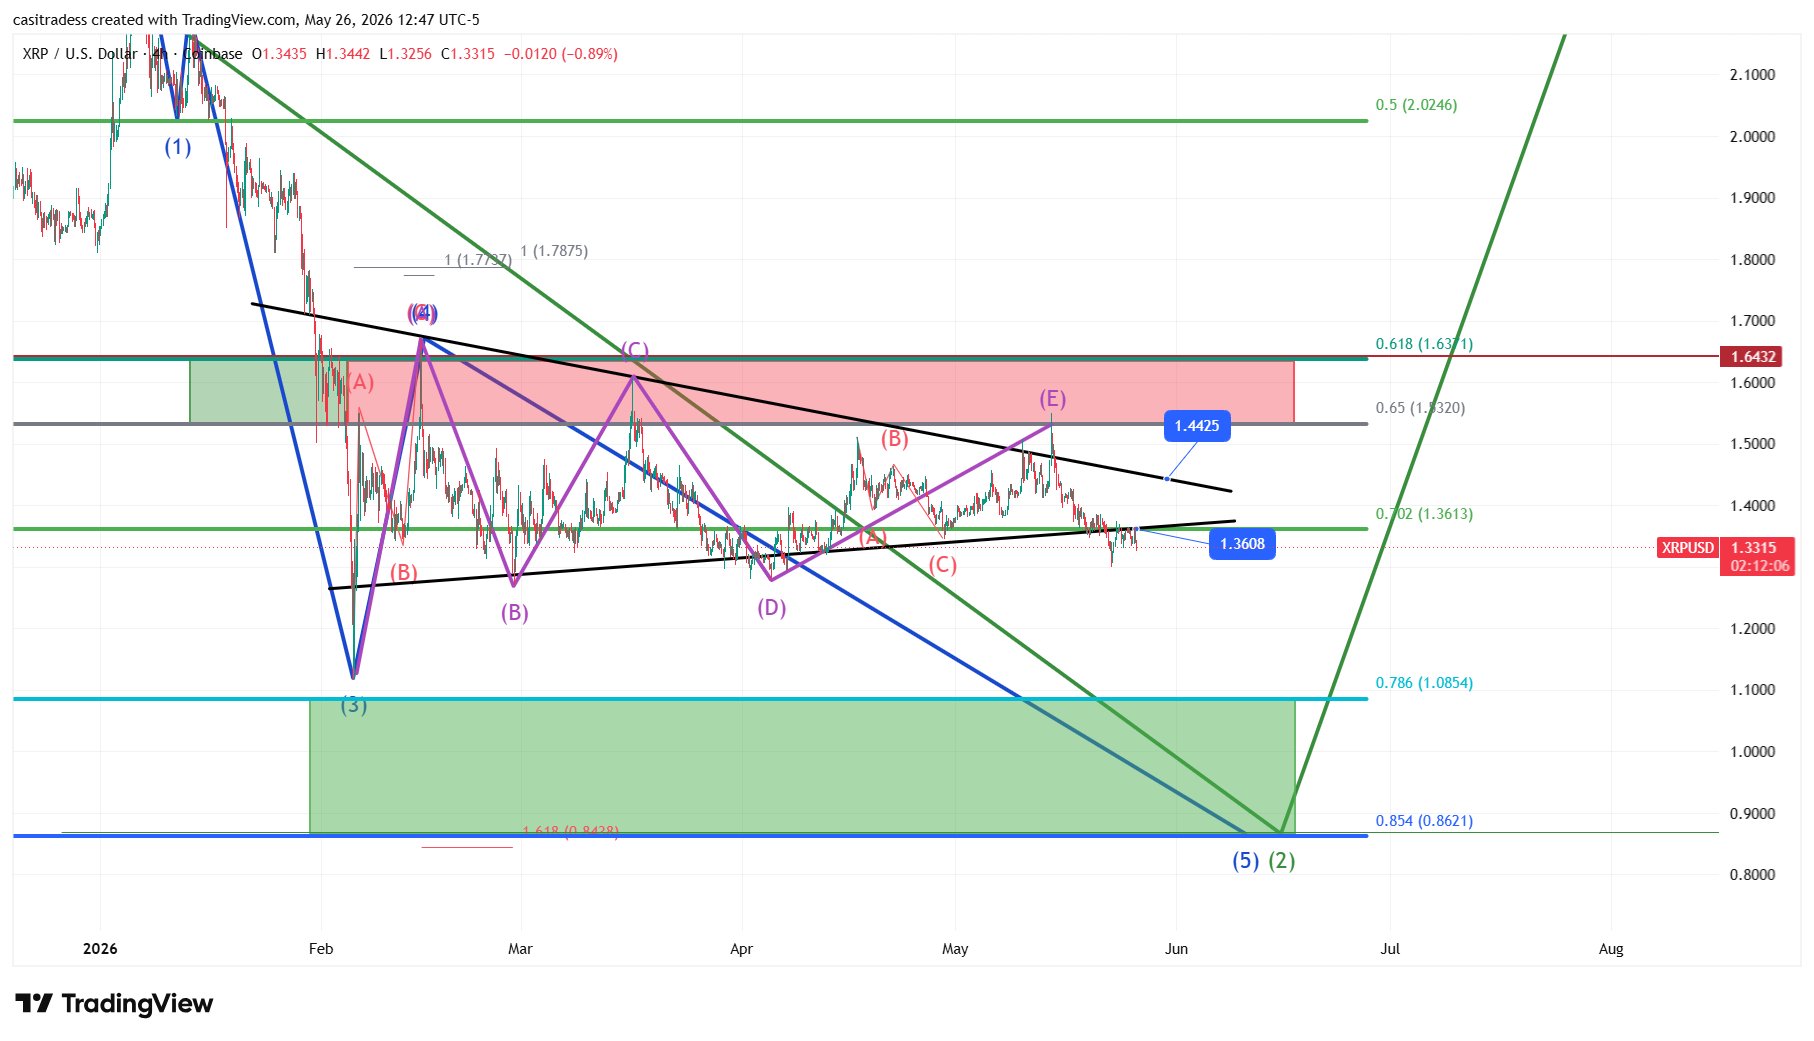
$XRP has struggled to break above a major resistance zone after several months of sideways price action, but a decisive move remains in the picture.
At press time, $XRP trades at $1.33, down slightly in the past 24 hours. While it has found stability around its current price, a major supply zone above has continued to hamper upside potential, increasing the risk of a further price pullback.
Key Points
$XRP has repeatedly faced rejection at or around the $1.65 resistance for four months now.
Its price action has also remained trapped within a broad consolidation structure on the 4-hour chart since February.
Multiple breakout attempts around the same resistance area in February, March, and May have failed.
The longer $XRP remains below $1.65, the greater the possibility of another move into lower macro support regions at $1.10 and $0.87.
If $XRP successfully reclaims $1.65 and turns it into support, it will confirm the necessary momentum for the next upward move.
Know when your coins move
Alerts, real-time prices, and market news — all in one app
4.8 based on 40K reviews in the App Store and Google Play
$XRP and the $1.65 Resistance
The current trend has caught the attention of market analyst CasiTrades. In her recent X post, she highlighted the repeated rejections below the $1.65 resistance. $XRP has been like this for four months, reinforcing the zone as a stronghold.
Meanwhile, its price action has remained trapped within a broad consolidation structure on the 4-hour chart since February. Within this wedge, $XRP has made lower highs and higher lows, with each swing high fading at or near the golden pocket Fibonacci level between $1.65 and $1.53.
The accompanying chart highlights multiple failed breakout attempts around the same resistance area, suggesting buyers are still unable to establish sustained control above that level. The lower highs on February 5, March 17, and May 14 to $1.67, $1.60, and $1.55, respectively, confirmed this trend.
$XRP Stuck Below $1.65 Resistance/CasiTrades
Currently, $XRP has slipped below the lower support of the price range, an area that has cushioned price weakness over the past 4 months. At its current price, it also sits below the $1.36 support level, adding pressure on the asset.
The Clock Is Ticking for $XRP
According to CasiTrades, the clock is ticking for $XRP. The longer it remains below the $1.65 resistance zone, the greater the possibility of another move into lower macro support regions.
The analyst noted that two technical levels have been at the center of her prediction for such a scenario. These areas are around $1.10 and $0.87, which would mark a decline of 17% to 34% from the current market price. Both areas align with the 0.78 and 0.85 Fibonacci retracement levels, respectively.
Notably, this adds to the list of analysts expecting further declines in $XRP unless current market conditions change. Recently, Ali Martinez highlighted the $0.73 support as an area he is closely watching should the price drop further.
Recovery Heavily Depends on Reclaiming Key Resistance
Despite the recent weakness, the analyst suggests that a “violent” recovery would develop after retesting the macro support areas. However, the real confirmation of the move would be a reclaim of the $1.65 resistance.
If $XRP successfully reclaims this resistance and turns it into support, it will confirm that it has the necessary momentum for the next upward move. That move from both macro supports would mark increases of 89% and 50%. Meanwhile, from the current price, it represents a 24% growth.
The experienced trader concluded that “time is up” as $XRP has been consolidating within this tightening structure for a long time. She expects a decisive move in $XRP any time soon.

 thecryptobasic.com