XRP Has Been Underperforming Bitcoin Since 2017 With No Signs of Major Rotation: Analyst
thecryptobasic.com
27 May 2026 00:16, UTC
$XRP has underperformed against Bitcoin, with chart analysis showing a clear sign of structural weakness, despite periods of sharp rises.
Analyst Chart Nerd shared this as a reality check for $XRP enthusiasts. While he has long been a prominent community voice, his analysis highlights that, beyond the hype, $XRP’s price performance has been discouraging compared to Bitcoin’s.
Key Points
$XRP has underperformed against Bitcoin both in the short and long term.
Bitcoin grew from $60,000 to $82,800 in the past three months, but $XRP has not kept pace with that.
The $XRP/$BTC pair has maintained a pattern of lower highs since 2017, struggling beneath a major descending resistance trendline.
With the trend strengthening, analysts predict further decline for this pair.
$XRP is primed for higher prices in the long term, but could continue to underperform Bitcoin for most of 2026.
Know when your coins move
Alerts, real-time prices, and market news — all in one app
4.8 based on 40K reviews in the App Store and Google Play
$XRP Trails Bitcoin in Recent Price Performance
One of Chart Nerd’s strong points is the contrast in performance over the past three months. During this period, Bitcoin grew 38% from its yearly low of $60,000 to $82,800 this month. However, $XRP failed to keep pace with that on the $BTC pair, slipping back below its 20-month exponential moving average.
Notably, this does not mean that $XRP did not rebound considerably from its February lows. In fact, it recorded a 37% increase from the lows of $1.12 to the May high of $1.54. However, against Bitcoin, it has looked weak.
Such market conditions, where major large caps trail Bitcoin, signal that investors still prefer the premier crypto asset. As such, capital either remains in $BTC or leaves the sector entirely, rather than rotating into altcoins like $XRP.
$XRP/$BTC Structure Still Looks Weak
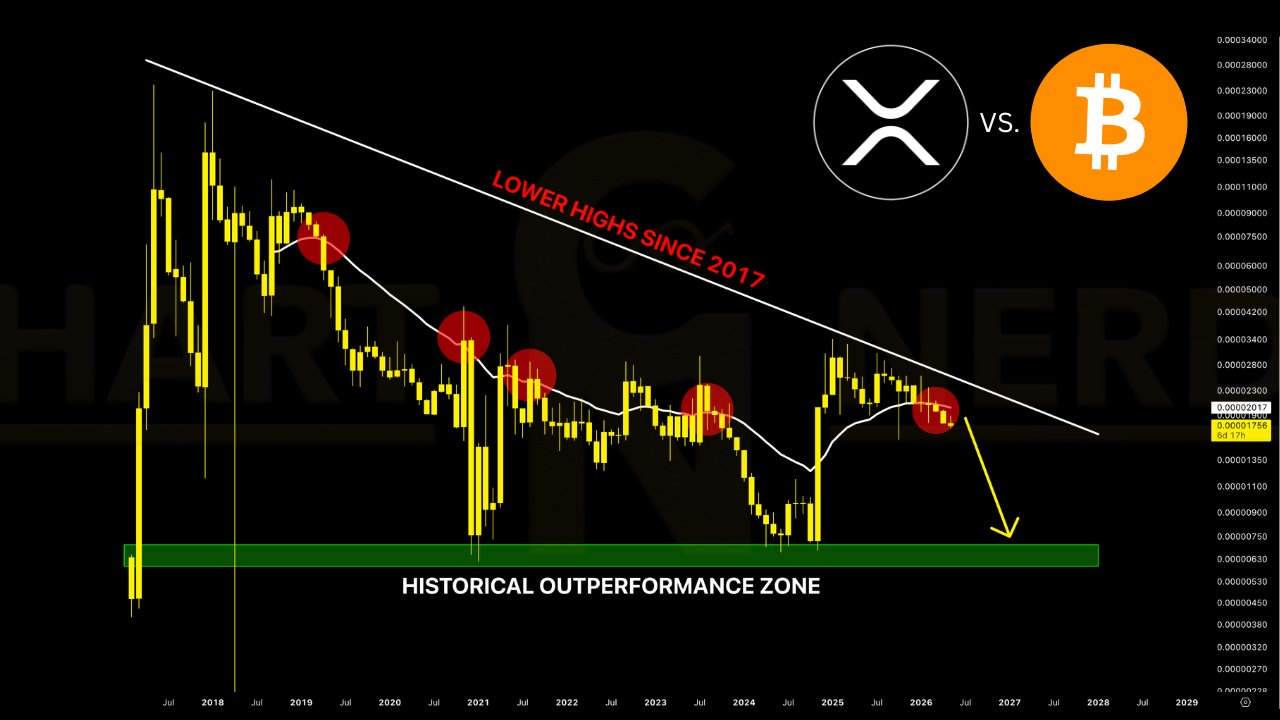
Beyond the recent performance, an accompanying chart shows that this pattern extends to the long term. The $XRP/$BTC pair has maintained a pattern of lower highs since 2017, struggling beneath a major descending resistance trendline that has capped every major recovery attempt for years.
The chart highlights several failed breakout attempts across multiple cycles, each marked by lower peaks beneath the descending resistance line. For context, the pair’s peaks near 0.000097 in January 2019, 0.0000426 in November 2020, 0.0000390 in May 2021, 0.0000297 in July 2023, and, most recently, 0.0000257 in January 2026 were all lower highs, each capped below this resistance trendline.
Notably, this suggests that, despite occasional rallies, $XRP has consistently lost strength relative to Bitcoin over the broader timeframe.
Nonetheless, a positive is that $XRP has held above another important area on the chart labeled as the “historical outperformance zone.” $XRP/$BTC has approached this strong support region several times over the years, with buyers consistently stepping in near those levels.
More Downside Risk
With the trend strengthening, Chart Nerd predicts further decline for this pair. Following its recent drop below the 20-month MA and earlier rejection from the descending trendline, he expects the $XRP/$BTC pair to trend lower.
The target is near the green support area, which has historically cushioned price weakness. This would push the pair into the 0.0000071-0.0000065 range, a 59%-62% drop from the current level near 0.0000174. This means $XRP would drop considerably while Bitcoin consolidates or falls deeper under mild corrective momentum.
Notably, several other analysts have remained bearish on $XRP even as sentiment drops to FUD zones and market uncertainty persists. Recently, top chartist Ali Martinez predicted a possible drop to the $0.73 region if corrective momentum endures.
However, Chart Nerd is not entirely bearish on $XRP. He still expects higher prices for the asset in the long term, but sees it underperforming Bitcoin for most of 2026.

 thecryptobasic.com