Render Price Prediction: On-Chain Activity Hits 12-Week High as RNDR Eyes $2.56
coinedition.com
26 May 2026 11:23, UTC
Render trades at $2.363 on May 26, snapping a four-month ceiling with its strongest on-chain session since February, as the AI infrastructure trade rotates back into GPU compute plays and fresh wallets flood the network at the fastest pace in 12 weeks.
Render Price Chart: Two Fibonacci Levels Down, $2.56 Is the Next Target
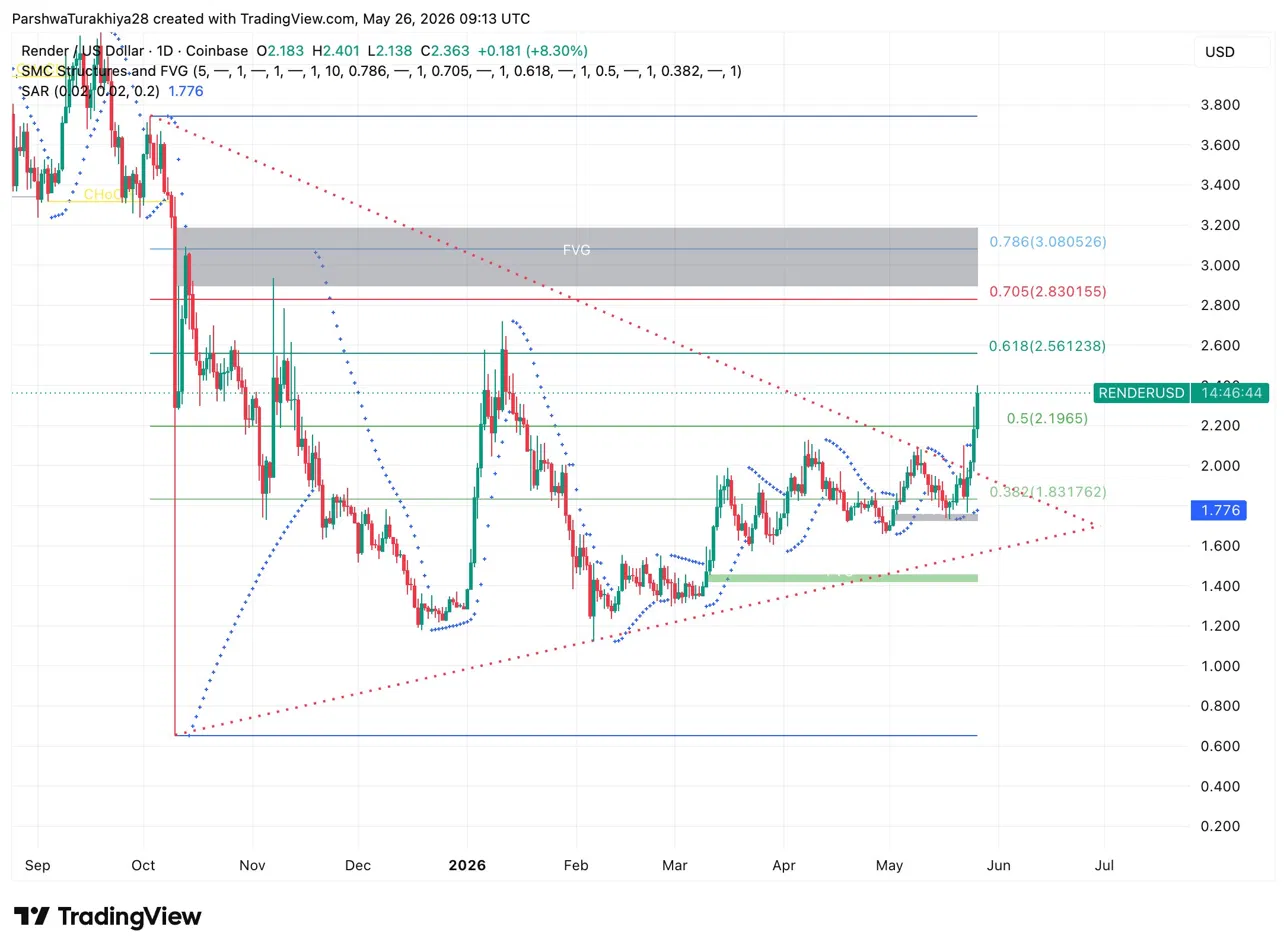
RNDR Daily Price Action (Source: TradingView)
The daily chart has flipped. Price cleared the 0.382 Fib at $1.83 and the 0.5 Fib at $2.1965 back to back, closing above both on heavy volume. The Parabolic SAR at $1.776 now sits well below price, confirming the daily trend has turned bullish.
Know when your coins move
Alerts, real-time prices, and market news — all in one app
4.8 based on 40K reviews in the App Store and Google Play
Above current price, the 0.618 Fib at $2.5612 is the immediate target, followed by the 0.705 at $2.8301 and the grey FVG zone sitting between $3.00 and $3.20, where the 0.786 Fib at $3.08 lands. On the downside, $2.19 is the level bulls must hold on any pullback to keep the structure intact.
Why Is Render Pumping? AI Rotation and Real Network Growth
📈 Render’s on-chain activity has seen a major breakout in late May, jumping back above $2.25 for the first time in over 4 months. Daily active addresses climbed to 394 in a single day with 118 new wallets created, both hitting their highest marks in 12 weeks. These two metrics… pic.twitter.com/gFJAl2ipJj
— Santiment Intelligence (@SantimentData) May 26, 2026
Santiment flagged a breakout in Render’s on-chain activity, with daily active addresses climbing to 394 and 118 new wallets created in a single session, both at 12-week highs. Active addresses measure real network interaction, and new wallet creation points to fresh participants entering rather than existing holders shuffling positions around.
Beyond the on-chain data, the macro shift is doing real work here. Iran de-escalation lifted the geopolitical overhang weighing on growth names, pushing capital back into US-aligned AI plays. Render sits squarely in that trade, powering GPU compute workloads for AI training and machine learning alongside its core rendering business, placing it directly inside NVIDIA’s projected demand expansion path. The weekly rally since May 18 carried real buying volume behind it, not the thin momentum that fades within days.
RNDR Futures Data: Volume Up 174%, Bears Getting Liquidated
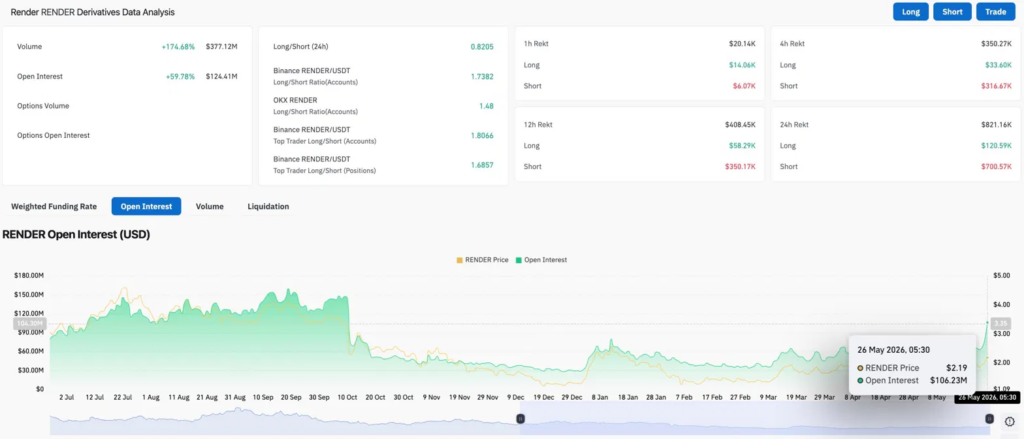
RNDR Derivative Analysis (Source: Coinglass)
Futures volume surged 174.68% to $377.12M while open interest climbed 59.78% to $124.41M. Price, volume, and OI all rising together is a clean bullish signal, fresh longs are entering the trade rather than just short covering driving the move. Short liquidations hit $700.57K over 24 hours against just $120.59K for longs.
The long/short ratio on Binance sits at 1.7382, with top traders running 1.8066 by accounts and 1.6857 by positions, both skewed firmly long.
Render Price Prediction for May 27
Upside: Holding $2.19 keeps the path open to the 0.618 Fib at $2.56, with $2.83 as the next level if volume holds through the week.
Downside: A daily close below $2.19 drags RNDR back toward $1.83, and losing that puts the green demand zone near $1.40 back in focus.

 coinedition.com