There’s a 53% Chance the XRP Broadening Wedge Structure Lifts Prices to $11
thecryptobasic.com
25 May 2026 15:18, UTC
There’s a 53% chance the $XRP descending broadening wedge structure lifts prices to the double-digit range.
$XRP remains under pressure after falling 11.6% in the last two weeks. Despite the recent decline, prominent market commentator EGRAG Crypto believes the asset is still following a descending broadening wedge pattern that could eventually lead to a strong upward move.
Key Points
$XRP has dropped 11.6% since May 14, trading within a descending broadening wedge pattern.
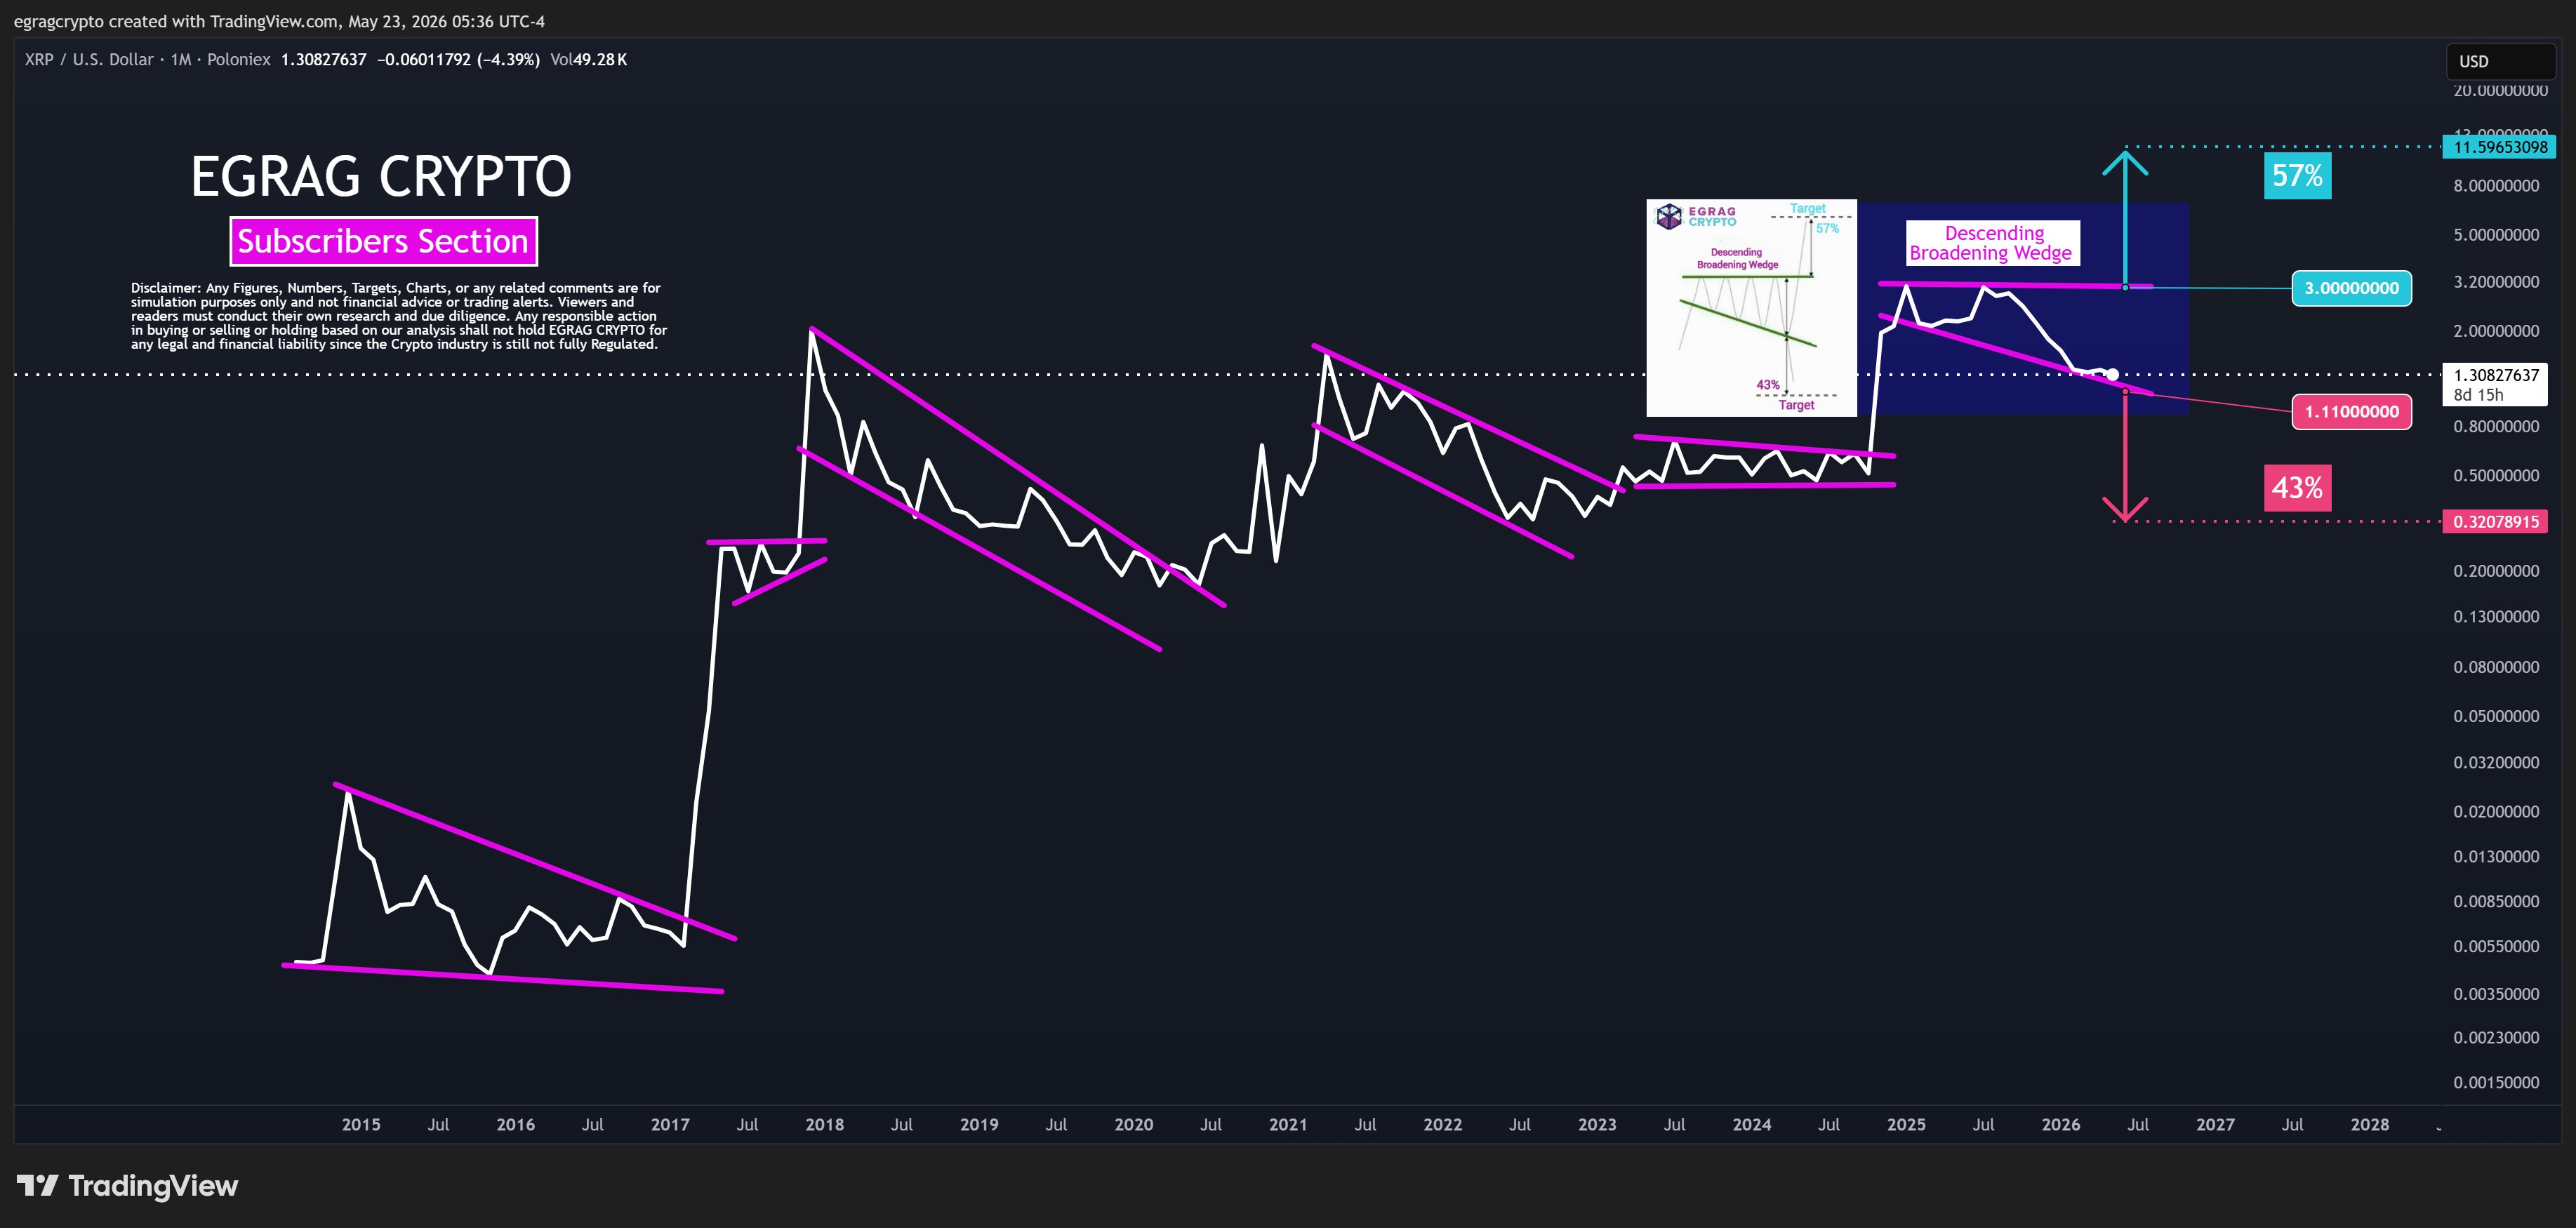
The price formed deeper lows at $1.61, $1.37, and $1.1 between April 2025 and February 2026, forming the lower trendline of the pattern.
EGRAG Crypto says there is a 53% that the pattern eventually sends $XRP toward the $7 to $11 range.
$XRP would have to first breach the structure’s upper trendline at $3 to soar upward.
The $1.11 acts as critical support, and $XRP could see a possible drop to $0.32 if it fails.
Know when your coins move
Alerts, real-time prices, and market news — all in one app
4.8 based on 40K reviews in the App Store and Google Play
$XRP Within Descending Broadening Wedge
EGRAG revealed this in a recent analysis shared on X, insisting that the current $XRP setup is not random amid the latest price correction.
He pointed out that the descending broadening wedge structure typically ends with one final sharp drop before prices suddenly move much higher. According to him, $XRP may still follow this path despite the current weakness in the market.
For context, a descending broadening wedge forms when the price moves lower between two widening trendlines. Notably, the upper resistance line slopes downward, while the lower support line falls even faster, creating a broadening shape.
$XRP Formed the Wedge After Pulling Back from Its 2025 High
Data from EGRAG’s chart shows that $XRP started forming the descending broadening wedge on the monthly chart after pulling back from the $3.4 high in January 2025. Since then, the asset has continued to record deeper lower lows, which led to the current structure.
The first major drop came in April 2025, when $XRP fell to $1.61 before recovering above $3. Later, during the broader market crash on October 10, 2025, $XRP dropped again to $1.37. This move created another lower low, although the asset quickly recovered afterward.
The downward trend picked up in late 2025 and has continued till now.Earlier this year, $XRP fell to $1.1, marking another lower low, before climbing back above the level. These repeated lower lows created a steep support trendline, which completed the broadening wedge pattern.
Important $XRP Price Levels to Watch
With $XRP currently in this structure, EGRAG highlighted several important price levels that traders should pay attention to. He called $1.11 the most important support level, as this was where buyers stepped in during the February 2026 crash.
Should bulls lose this $1.11 support, which aligns with the lower trendline of the wedge, $XRP could record further declines to as low as $0.32. This would equal a 71% drop from the $1.11 support area. EGRAG estimated a 43% chance that $XRP could take this direction from its current position.
On the bullish side, EGRAG said the $3.00 level remains the key resistance point to watch. For context, this level matches the upper trendline of the broadening wedge. If $XRP breaks above $3.00, this will confirm a bullish shift in momentum and open the way for much higher prices.
The analyst placed $XRP’s possible expansion targets between $7 and $11 or even higher if the breakout happens. He estimated a 53% chance that the pattern could play out this way and eventually push $XRP toward the $11 mark.
Analysts Expect More Volatility
Despite the bullish long-term outlook, EGRAG still believes $XRP faces short-term weakness. He stressed that the current market phase represents bearish compression. However, the larger structure remains bullish unless the pattern completely breaks down.
According to his outlook, $XRP could still go through more sideways movement, trader exhaustion, and another strong volatility event before making a major move.
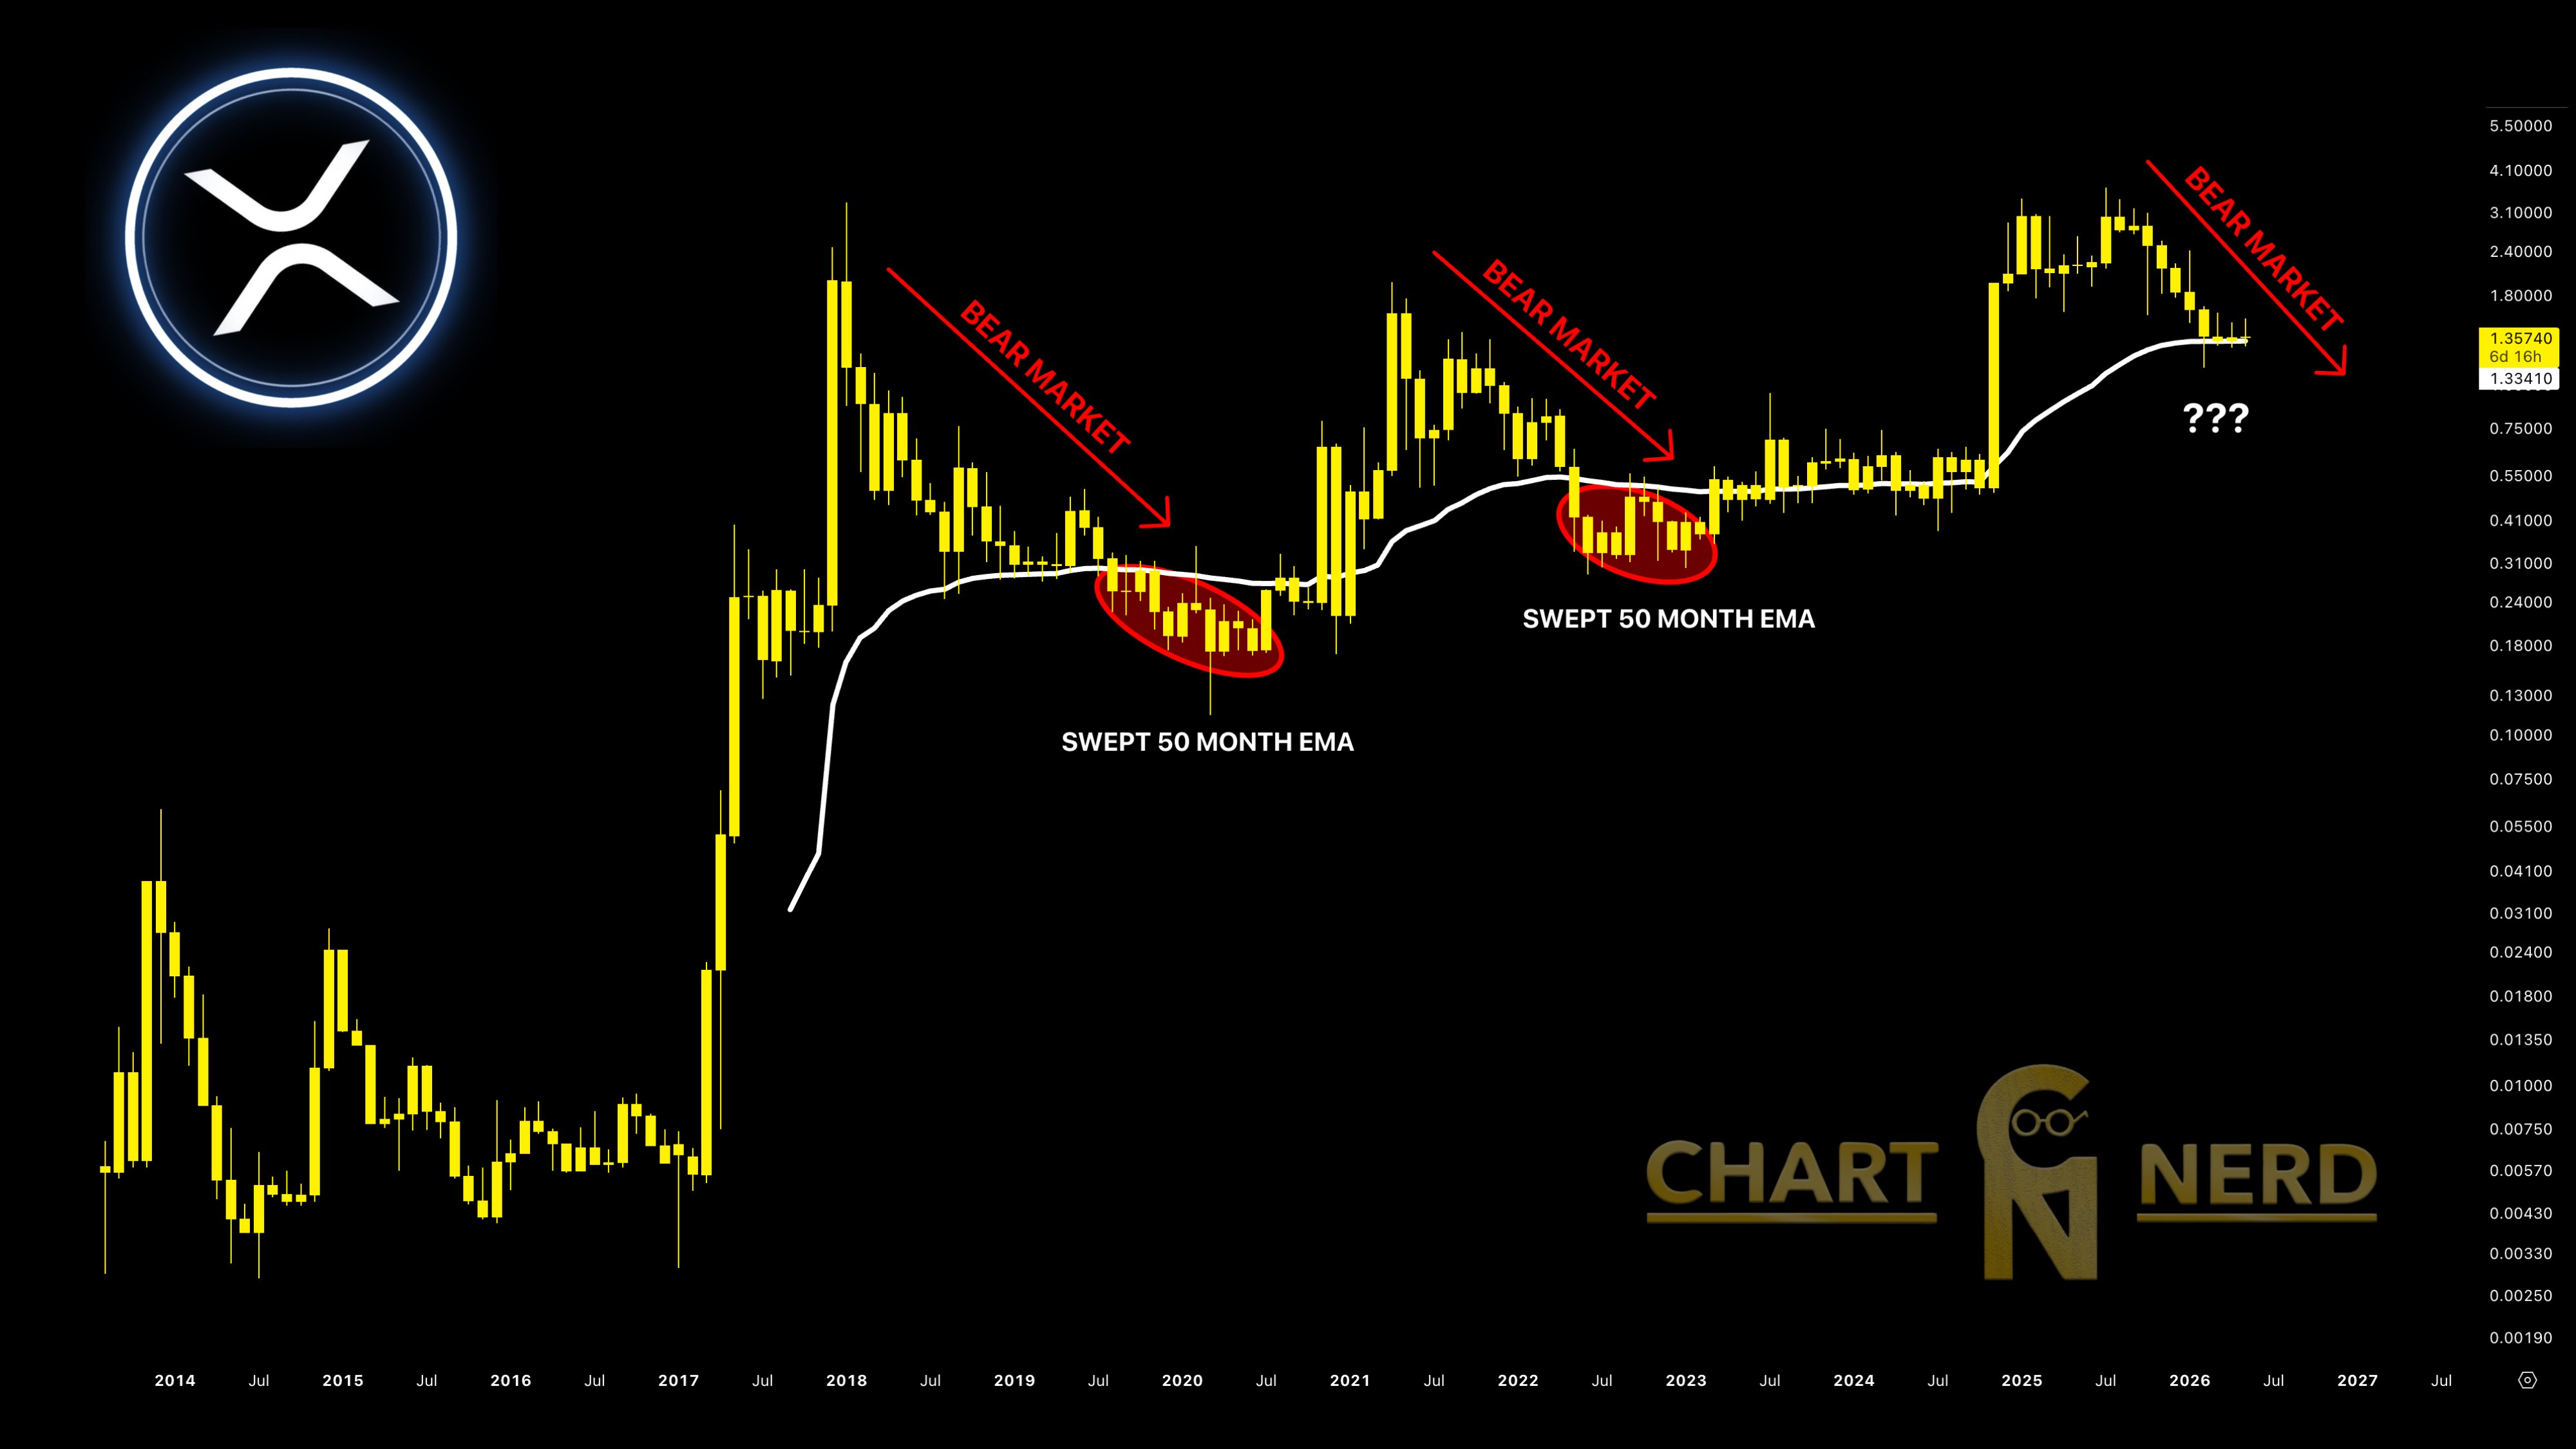
Meanwhile, another well-known analyst, Chart Nerd, highlighted$XRP’s long-term moving average support. In a separate analysis, he noted that $XRP has traded around its 50-month exponential moving average for nearly four straight months, with the indicator currently sitting near $1.30.
$XRP 50-Month EMA | Chart Nerd
Chart Nerd said the current situation resembles previous bear market periods.He pointed out that $XRP lost the same 50-month EMA during the 2019 to 2020 bear market before dropping 61%.In addition, $XRPfell 48% in 2022 after breaking below the indicator again.
Considering those past trends, the prominent market watcher warned that a monthly candle close below the 50-month EMA could act as an early warning sign for more downside pressure.

 thecryptobasic.com