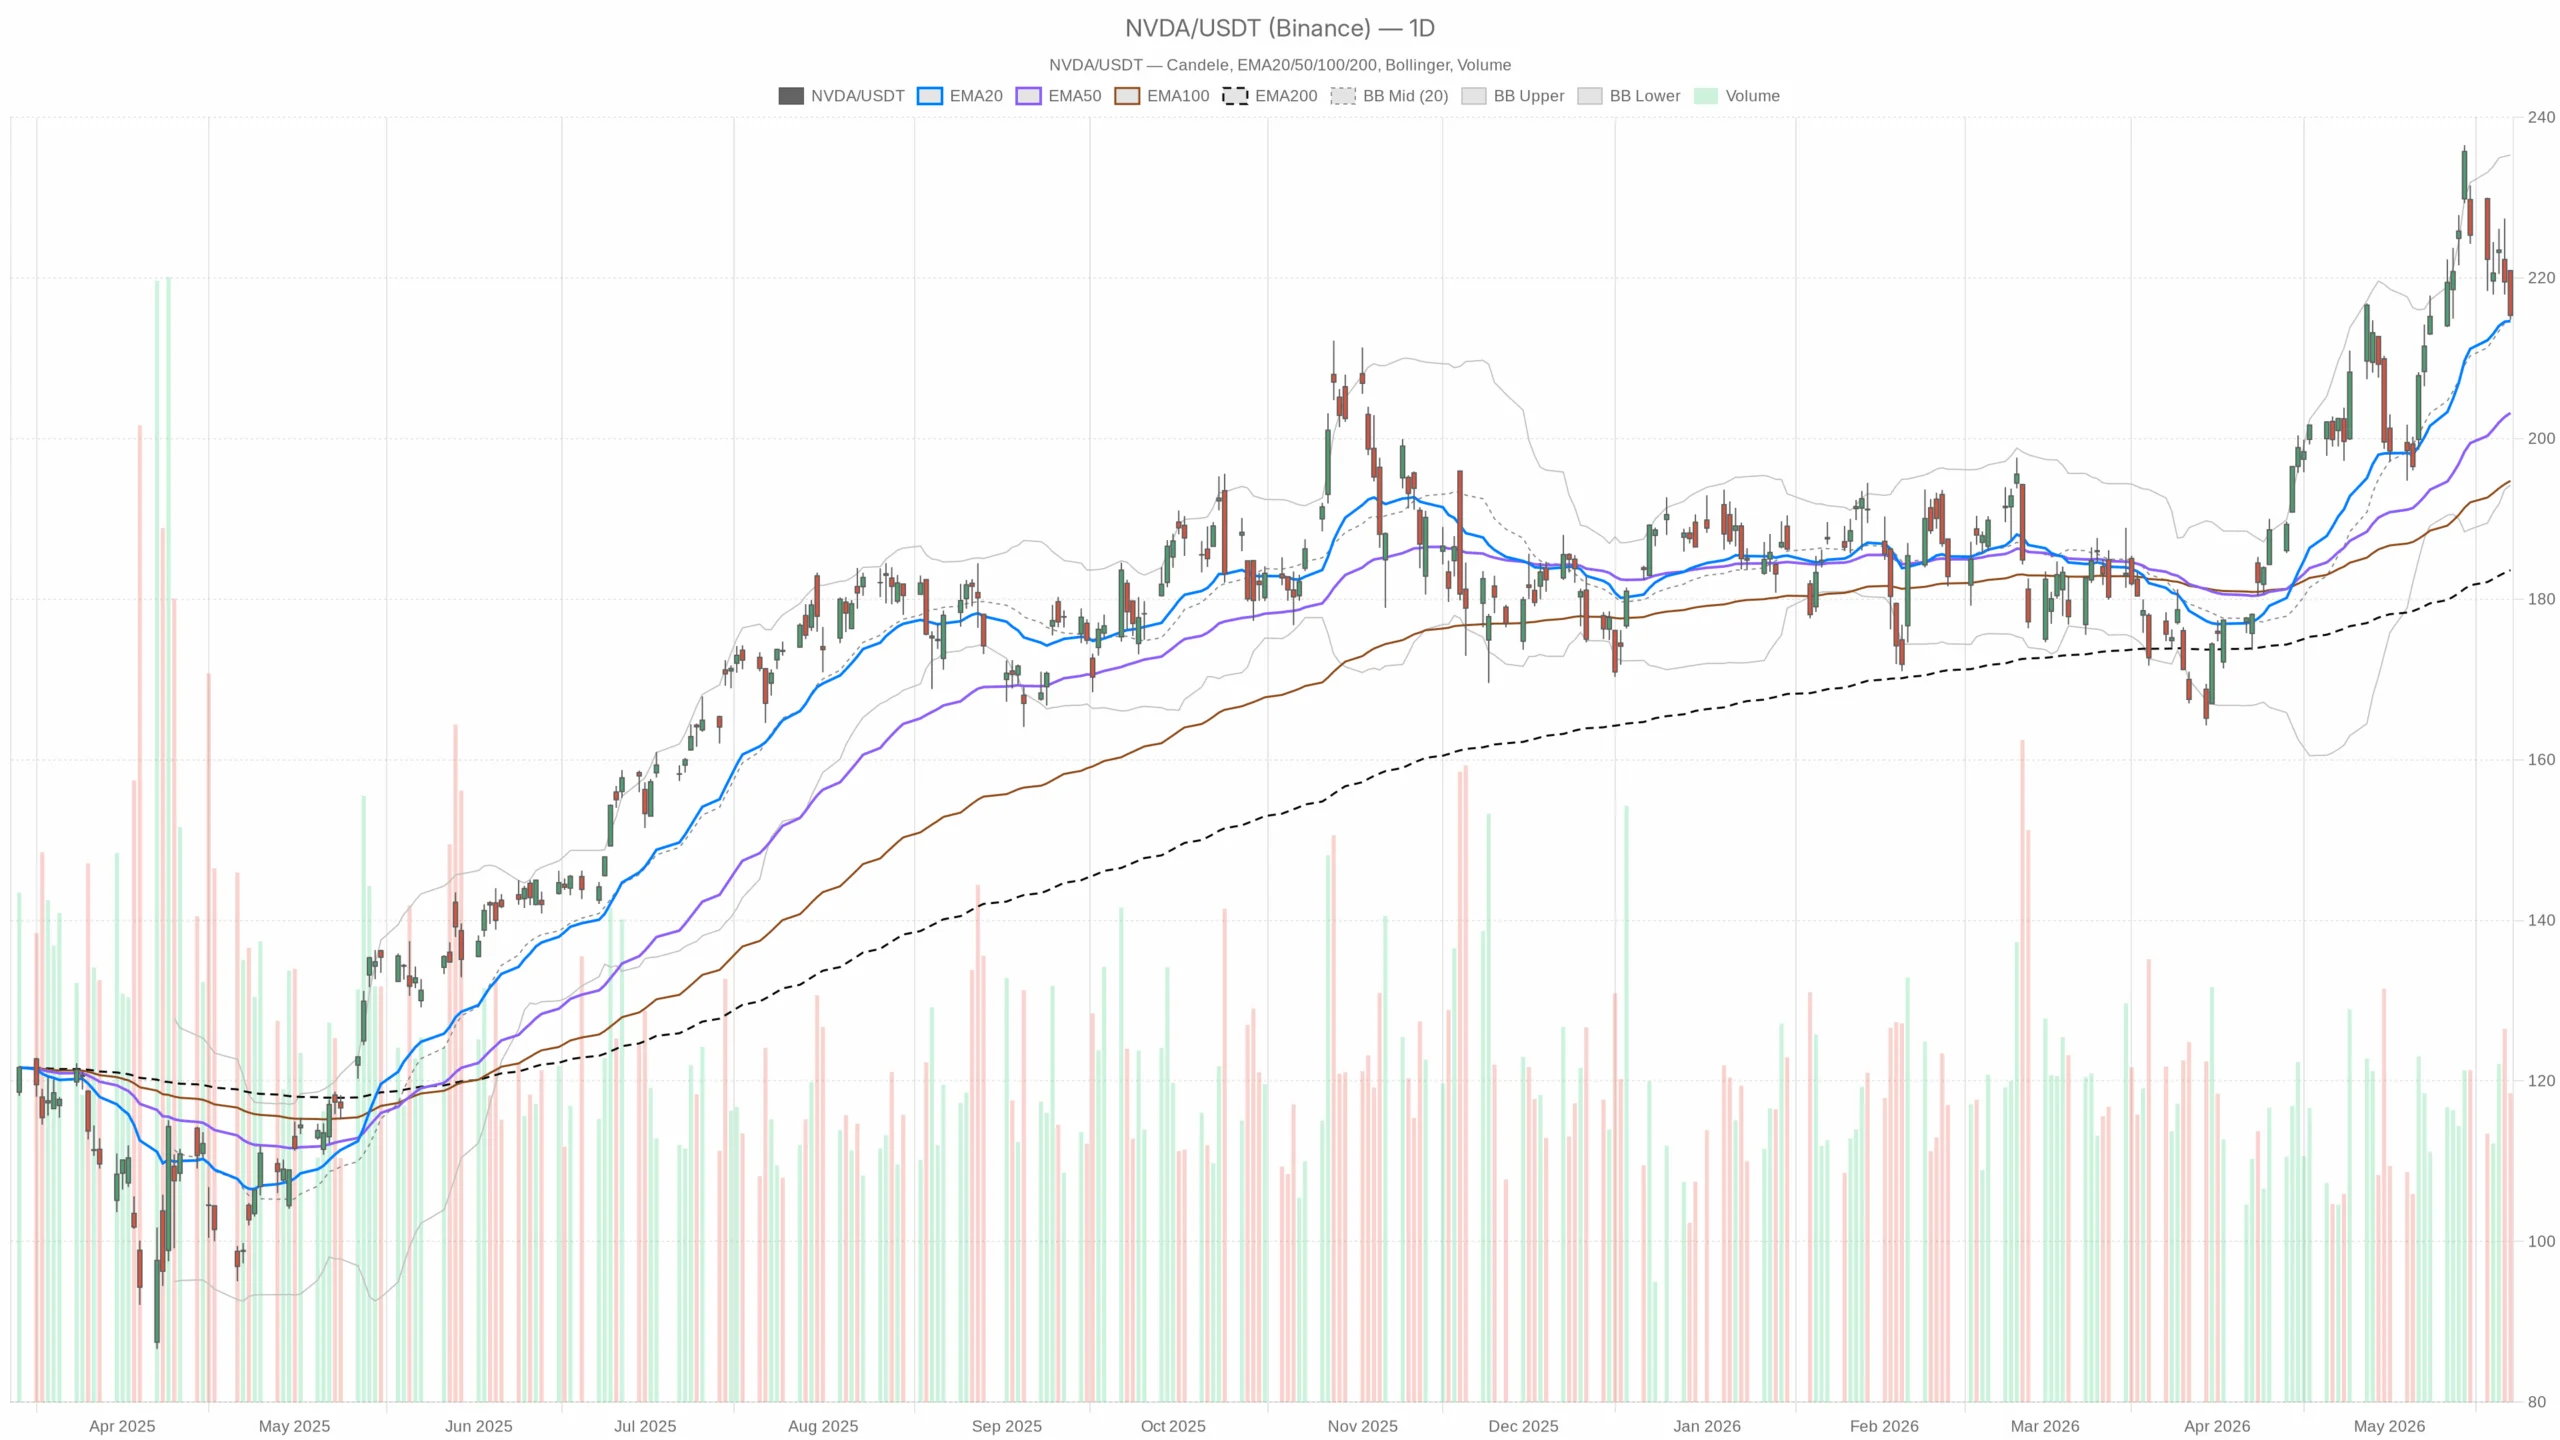
Daily Technical Structure for NVDA
Price and Moving Averages
On the daily chart, NVDA closed at 215.33, a touch above the 20‑day EMA at 214.63. The 50‑day sits at 203.19, and the 200‑day at 183.60. Human take: the structural uptrend is intact, but price is only marginally above the fast average. The daily RSI(14) is 53.71. Human take: momentum is neutral‑to‑bullish without overbought stress.
Momentum, Bands, and Pivots
However, daily momentum has eased. The MACD line (6.91) is below its signal (7.78) with a negative histogram of -0.87. Human take: upside impulse is fading, favoring consolidation. The Bollinger mid is 214.75 with bands at 194.19 and 235.30. Human take: price is back near the mean with room in both directions.
Notably, the ATR(14) is 8.29, underscoring wider daily ranges. The daily pivot is 217.05 with R1 at 219.29 and S1 at 213.08; spot closed under the pivot. Human take: reclaiming 217–219 would reassert control, while 213 is first downside defense.
Fundamentals: Supportive, Yet Digested
Meanwhile, fundamentals remain supportive but are being digested. Nvidia raised its dividend by 2,400%. Human take: stronger cash returns signal confidence without abandoning growth. The company also included China in a $200B CPU market projection. Human take: the long runway is intact, though policy frictions linger.
Notably, record quarterly revenue of $81.6B was reported for fiscal Q1 2027. Human take: the print was powerful, yet coverage flagged a downbeat initial reaction, consistent with a priced‑for‑perfection setup.
1H Intraday Tone: Pullback Inside the Uptrend
On the 1H timeframe, tone is softer and complicates the daily bias. Price at 215.25 sits below the 20‑EMA (219.07) and 50‑EMA (220.52), while the 200‑EMA holds lower at 210.20. Human take: it is an intraday pullback within a larger uptrend.
In contrast, the 1H RSI(14) at 36.5 shows sellers have the near‑term initiative, but conditions are not deeply oversold. The MACD is negative (line -1.94, signal -1.52, hist -0.42). Human take: downside momentum is active.
At the same time, the Bollinger mid is 220.00 with the lower band at 213.66. Human take: price leans toward the lower band, so a mean‑reversion bounce needs support to hold. The 1H ATR(14) is 2.79. Human take: swings near $3 can whipsaw entries. The hourly pivot is 215.43 with R1 at 215.76 and S1 at 214.93. Human take: a pivot reclaim would be the first tell that buyers are re‑engaging.
15‑Minute Execution View: Micro Trend Down
In the 15‑minute window, micro pressure remains down. Price is under the EMA20 (216.56), EMA50 (218.26), and EMA200 (221.09). Human take: the very short‑term trend is bearish.
Still, the 15m RSI(14) reads 33.49. Human take: nearing short‑term oversold, but not extreme. The MACD is slightly negative (line -0.92, signal -0.88, hist -0.04). Human take: selling pressure is easing, hinting at basing risk rather than a fresh leg lower.
Therefore, the Bollinger mid at 216.64 and lower band at 214.79 frame near‑term risk. Human take: price is stretched toward the lower band, which often precedes pause or bounce attempts. The 15m ATR(14) is 0.84. Human take: sub‑$1 bars still matter for entries. The 15m pivot is 215.46 with R1 at 215.73 and S1 at 214.99. Human take: micro resistance sits just overhead.
Bullish Path: Stabilize 213–215, Then Reclaim 217–219
Therefore, the bullish path hinges on stabilization above 213–215 followed by a decisive reclaim of 217–219. A daily close back over the pivot (217.05) and into R1 (219.29) would signal control shifting to buyers. Human take: alignment improves if the 1H RSI pushes toward 50 and the MACD histogram flattens to zero.
Bearish Path: Clean Break of 213 Exposes 210 and 203
On the other hand, the bearish setup strengthens on a clean break below 213.08. That would expose the 1H 200‑EMA near 210.20 first, with the daily 50‑EMA at 203.19 as a deeper target if pressure persists. Human take: losing 213 while the daily MACD histogram expands negative would invalidate the near‑term bullish case and cap rallies under the 20‑day EMA.
Overall, the primary trend in Nvidia Stock is still up, but the tape is in digestion mode after an exceptional fundamental stretch. With ATR elevated across timeframes, expect wider ranges and fast reversals. Until 217–219 is reclaimed, positioning remains tactical and headline‑sensitive.

 en.cryptonomist.ch