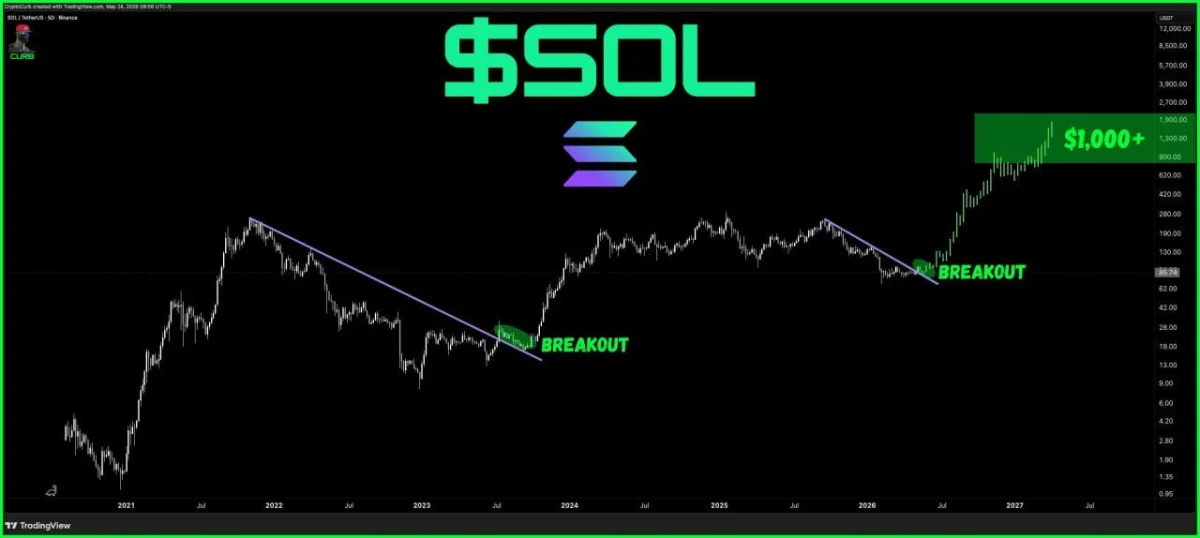
Solana Breakout Target Chart. Source: CryptoCurb on X
The latest setup shows $SOL pushing above another descending trendline near the right side of the chart. CryptoCurb labels this area as a breakout, with the projected path pointing toward much higher levels.
The chart marks a long term upside zone between roughly $900 and $1,900, with $1,000+ written as the main target. That means the analyst expects $SOL to move far above its current range if the breakout continues.
However, the setup still needs follow through. $SOL would need to hold above the broken trendline and keep forming higher lows for the breakout to stay valid.
A failed retest would weaken the structure and could send price back into the previous range.
For now, the key point is clear. $SOL has broken above a long term descending resistance line, and CryptoCurb sees that breakout as the start of a possible move toward $1,000+.
Solana Price Chart Shows $SOL Path Toward $500 to $675
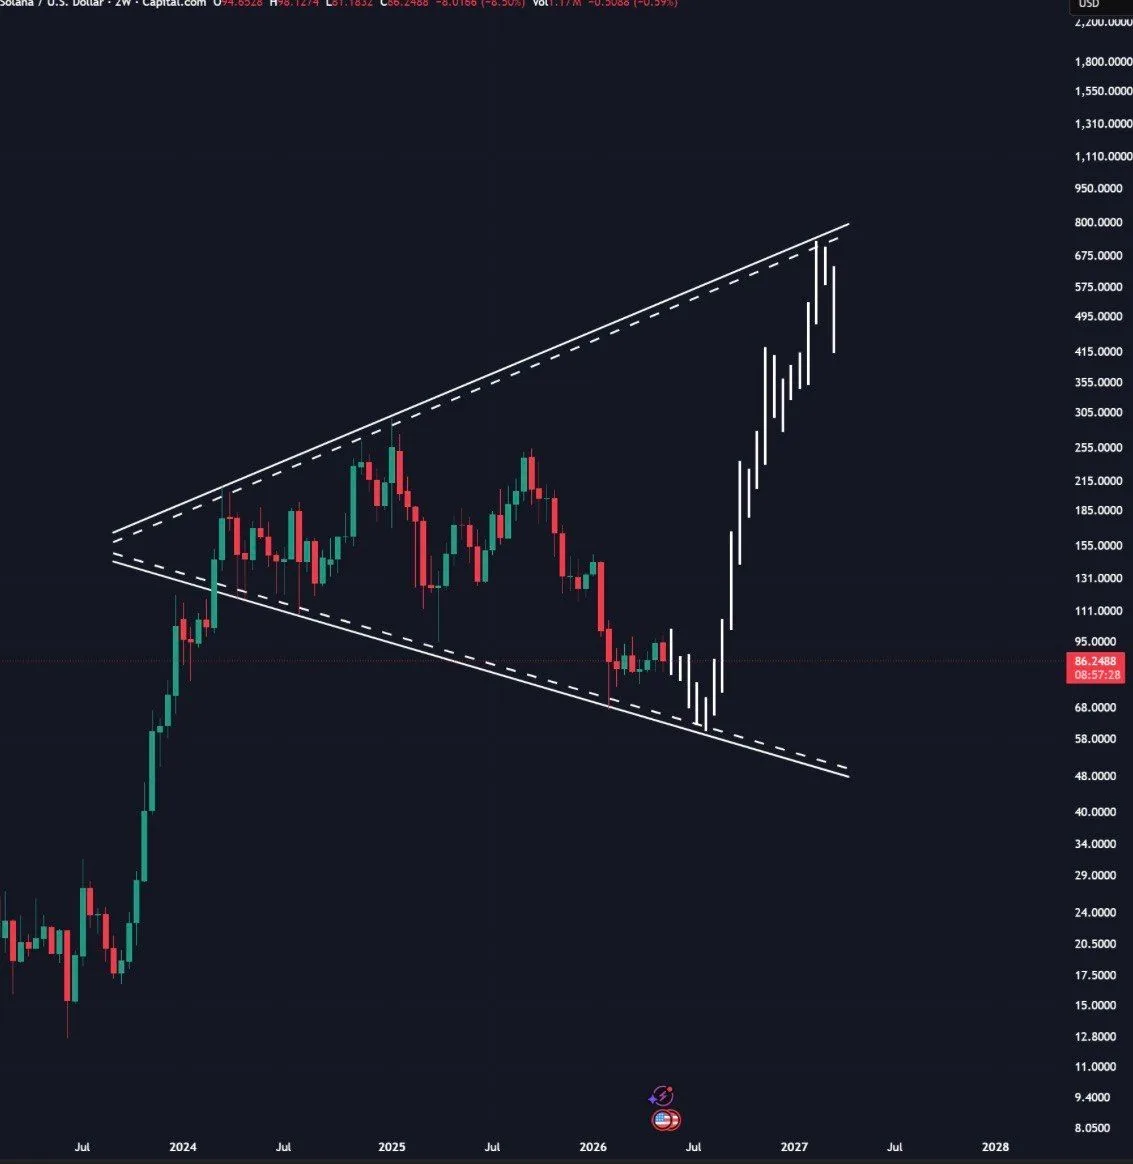
Solana’s two week chart shows $SOL moving inside a large long term structure, with the analyst projecting a future rally toward the $500 to $675 area.
The chart shared by ChiefraT shows $SOL trading near the lower side of a broad channel after a long pullback from its previous highs. The white projected path shows a possible rebound from this lower area.
Solana Long Term Rally Chart. Source: ChiefraT on X
The main idea is that $SOL may be building a base before another larger move. The chart points to a gradual recovery first, then a stronger rally toward the upper part of the structure.
ChiefraT said counting $SOL out long term “could be a big mistake.” The analyst also said the next rally may be the biggest one, with the projected path aiming at $500 to $675.
However, the setup still needs confirmation. $SOL would need to hold the lower channel area and start forming higher lows. A clean move above the current range would make the bullish path stronger.
If $SOL loses the lower channel support, the projected move would weaken. In that case, price could stay in the range longer before another breakout attempt.
For now, the chart points to one key setup. $SOL is near a lower long term support area, while the projected path shows a possible climb toward $500 to $675 if buyers regain control.

 coinpaper.com