$XRP trades at $1.3116 on May 23, breaking below the symmetrical triangle base that held since February, as whale transaction volume drops 57% in nine days and ETF buyers keep adding at levels the price action is not reflecting.
$XRP Daily Chart: Triangle Base Gone, February Low Is Next
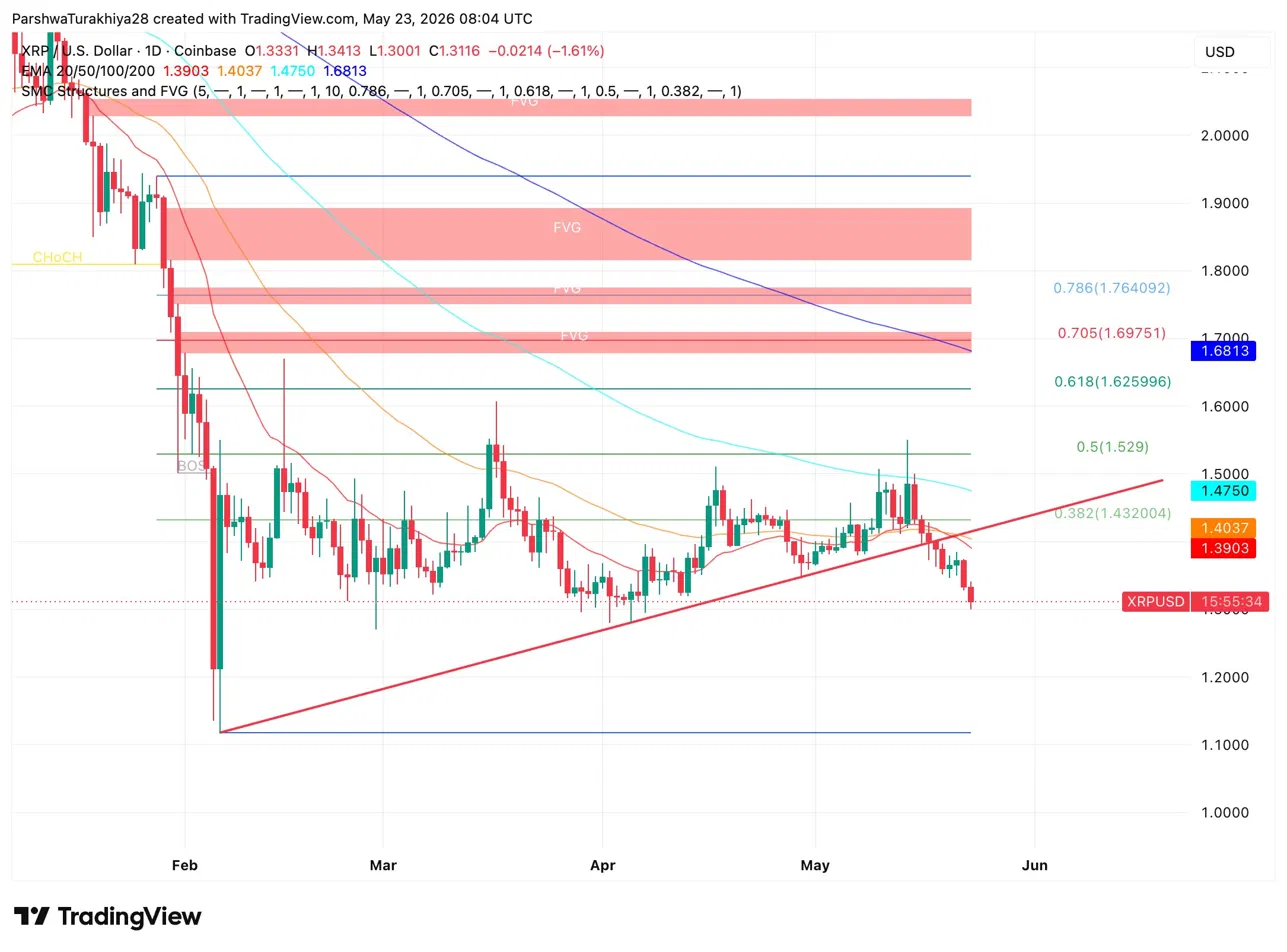
The symmetrical triangle that compressed $XRP for five months broke to the downside. Price closed below the $1.30 base, losing the level that held through every pullback since February. All four EMAs are above price. The 20 EMA at $1.3903 and 50 EMA at $1.4037 are the first resistance, followed by the 100 EMA at $1.4750 and 200 EMA at $1.6813.
Below current price, the February low at $1.15 is the only established support on the chart. There is no structure between $1.30 and $1.15. Four FVG zones sit above from $1.697 to $2.00, but those only matter after $XRP reclaims the triangle base.
Key levels:
- Resistance: $1.30 (former triangle base), $1.3903 (20 EMA), $1.4037 (50 EMA), $1.4750 (100 EMA)
- Support: $1.15 February low
- FVG cluster: $1.697 to $2.00, overhead
$XRP Whale Activity Down 57%: What It Actually Means
In the last 9 days, whale activity on the $XRP network has dropped from 157 large transactions worth over $1 million to just 67 today, representing a 57.3% decline.
— Ali Charts (@alicharts) May 23, 2026
When large-scale transaction volume thins out like this, it tells me the market could be entering a compression… pic.twitter.com/lVQGjhqVzG
Ali Charts flagged that large $XRP transactions over $1M dropped from 157 to 67 over nine days, a 57.3% decline. The read is a compression phase where whales have stepped back rather than actively pushing price in either direction.
Context matters here. $XRP dropped from $1.55 after the CLARITY Act spike to $1.31 in under two weeks. A 57% drop in whale activity during that decline suggests the largest wallets were not driving the selling. Mid-tier holders and retail were unwinding while whales went quiet. Whether that quiet turns into accumulation at current levels or stays as absence is what the next few sessions will show.
$XRP ETF Inflows Hold While Price Falls
$XRP spot ETFs recorded $9.47M on May 22 and $8.88M on May 21. Franklin’s XRPZ led May 22 with the full $9.47M. Cumulative inflows sit at $1.41B with total net assets at $1.13B.
Nine of the last eleven trading sessions were positive for $XRP ETFs. Institutional buyers have not flinched through a 15% price decline from the CLARITY Act peak. That steady accumulation into weakness is a different signal than the retail and mid-tier selling visible on-chain.
$XRP Price Prediction for May 24
- Upside: Reclaiming $1.30 on a daily close is the minimum before any recovery makes sense. Whale transactions recovering back above 100 per day would signal accumulation has started. Senate floor progress on the CLARITY Act remains the macro catalyst that could reverse the trend fast.
- Downside: No support between $1.30 and $1.15. Whale transactions staying below 70 per day and ETF inflows slowing would confirm the compression has shifted to distribution. A daily close below $1.20 puts $1.15 in play immediately.